Find the area of the triangle. 8 m
5 m
Question content area bottom
Part 1
The area of the triangle is 1 m cubed. (Type a whole number. )
Answers
The area of the triangle is 20 square meters.
The formula to find the area of a triangle is A = 1/2 * base * height. In this case, the base of the triangle is 8 meters and the height is 5 meters. Therefore, the area of the triangle is A = 1/2 * 8 m * 5 m = 20 m^2.
We can also check our answer by using the formula A = (b * h) / 2, where b is the base and h is the height of the triangle. Substituting the values given in the question, we get A = (8 m * 5 m) / 2 = 20 m^2. Therefore, the area of the triangle is 20 square meters.
For more questions like Triangle click the link below:
https://brainly.com/question/2773823
#SPJ11
Related Questions
results of regression analysis are often abused in the following ways:
a.Using the model without understanding the context in which the model was developed and recommended for use
b.Predicting outside the region of the data without noting the predictions are an extrapolation of the model
c.Ignoring known scientific and economic theory regarding the model and its variables
d.All of the above
e.None of the above
Answers
The correct answer is d) All of the above. Regression analysis results are often abused by using the model without understanding its context, predicting outside the data range without acknowledging extrapolation, and disregarding known scientific and economic theories related to the model and its variables.
Regression analysis is a statistical method used to examine the relationship between variables and make predictions based on the observed data. However, the misuse and misinterpretation of regression analysis can lead to erroneous conclusions.
Firstly, using the model without understanding its context can be problematic. The development and recommendation of a regression model are typically based on specific assumptions and limitations, as well as the data used in its construction. Applying the model to a different context without considering these factors may lead to inaccurate predictions or interpretations.
Secondly, predicting outside the region of the data without recognizing that it involves extrapolation is another common misuse of regression analysis. Extrapolation involves making predictions beyond the observed data range, which can be risky since the relationship between variables may not hold true outside the data range. Extrapolation should be approached cautiously and accompanied by a clear acknowledgement of its inherent uncertainties.
Lastly, ignoring known scientific and economic theory related to the model and its variables can also lead to misuse. Regression analysis should be interpreted in the context of existing theories and domain knowledge. Disregarding established theories can result in flawed conclusions or invalid interpretations of the regression model's results.
In conclusion, regression analysis should be used with care and understanding. It is crucial to consider the context, acknowledge the limitations of extrapolation, and incorporate relevant scientific and economic theories to ensure the appropriate use and interpretation of regression analysis results.
Learn more about regression analysis here:
https://brainly.com/question/31873297
#SPJ11
geometry solve for x

Answers
Answer:
x = 74 degrees
Step-by-step explanation:
If we assume that this triangle is isosceles, then the sum of the two angles at the bottom is (180 - 32) degrees, or 148 degrees. The angle x is half that, i. e., x = 74 degrees
Find the perimeter of the triangle.
A) 20
B) 51
C) 12 + 74
D) 12 + 47

Answers
If y=5 Evaluate the expression 3y by substituting the value for the variable
Answers
Answer: 15
Step-by-step explanation:
y = 5
3(y) = answer
3(5) = 15.
Find the product of 3.145 by 3
Answers
Answer:
9.435
Step-by-step explanation:
I will give brainlist to whoever gives me the correct answer What is the answer for a sphere with the radius of 5 ft

Answers
Answer:
523.6 ft
Step-by-step explanation:
Answer:
Step-by-step explanation:
V=4/3 x π x r∧3
523.59878
Let A ⊆ N + and B ⊆ N + be nonempty sets of positive integers. Define A + B def = {a + b : a ∈ A, b ∈ B}. Show that A + B is finite if and only if both A and B are finite.
Answers
Therefore, we can conclude that if A and B are non-empty sets of positive integers, then A + B is finite if and only if both A and B are finite.
The given problem is asking us to prove that A + B is finite if and only if both A and B are finite, where A and B are non-empty sets of positive integers. Let us try to prove this claim.Step 1: Prove that A + B is finite if A and B are finiteWe can prove this statement by contradiction. Let's assume that A and B are finite, but A + B is infinite. Since A and B are finite, they must have a maximum element, say a_0 and b_0. Then, A + B contains all the positive integers greater than or equal to a_0 + b_0. But this contradicts the assumption that A + B is infinite. Hence, A + B must be finite.Step 2: Prove that A + B is infinite if A or B is infiniteLet's assume that A is infinite and B is finite. We will show that A + B is infinite. Since A is infinite, we can find a_1 > a_0 such that a_1 ∈ A. Similarly, we can find b_1 ∈ B such that b_1 > b_0. Then, a_1 + b_1 > a_0 + b_0. Thus, A + B contains all the positive integers greater than or equal to a_1 + b_1, which means A + B is infinite. Similarly, we can prove that A + B is infinite if B is infinite. Hence, we have proved that A + B is finite if and only if both A and B are finite.Conclusion:Therefore, we can conclude that if A and B are non-empty sets of positive integers, then A + B is finite if and only if both A and B are finite.
To know more about integers,
https://brainly.com/question/929808
#SPJ11
Find the missing side lengths. Leave your answers as radicals in simplest form.
X
45°

Answers

Sara has a spinner that is divided into sections with different colors. The results from 20 spins are shown in the table.
Color
Number of
Times Spun
Blue
4
Green
3
Orange
6
Grey
5
Pink
Based on these results, what is the probability that the spinner will land on pink on the next spin?
O A 2%
O B. 5%
O c. 10%
D. 20%
O E 72%

Answers
Answer:
The correct answer would be 20%.Step-by-step explanation:
If the spinner is divided into sections with different colors that would be four divided colors so the probability of it landing on each color will be 20%. BUT THE ANSWER COULD ALSO BE 25% even though it is not listed.x - 4x² + 2x³
What is the degree of the polynomial?
Answers
Answer:
3
The degree of a polynomial is the highest power of any variable in the polynomial equation.
Here the highest power is 3 of the monomial with co-efficient of 2.
an airplane descends 2.2 miles to an elevation of 5.95 miles. find the elevation of the plane before its descent.

Answers
Answer:
8.15 miles
Step-by-step explanation:
5.95+2.2=8.15
PLEASE HELP I WILL GIVE BRAINLIEST FIND THE SURFACE AREA

Answers
Answer:
205.28
Step-by-step explanation:
See the screenshot provided for full steps and solution.

What is the value of 3(x - y) if x = 9 and y = -2*
Answers
Answer:
33
Step-by-step explanation:
1. 3(x - y)
2. 3(9 - -2)
3. 3(9 + 2)
4. 27 + 6
5. 33
\(3(x - y)\)
where x = 9 and y = - 2.
Substitute x = 9 and y = -2 in.\(3(9 - ( - 2)) \\ 3(9 + 2) = 3(11) \\ 33\)
Hence, the answer is 33.
Answer\( \large{33}\)
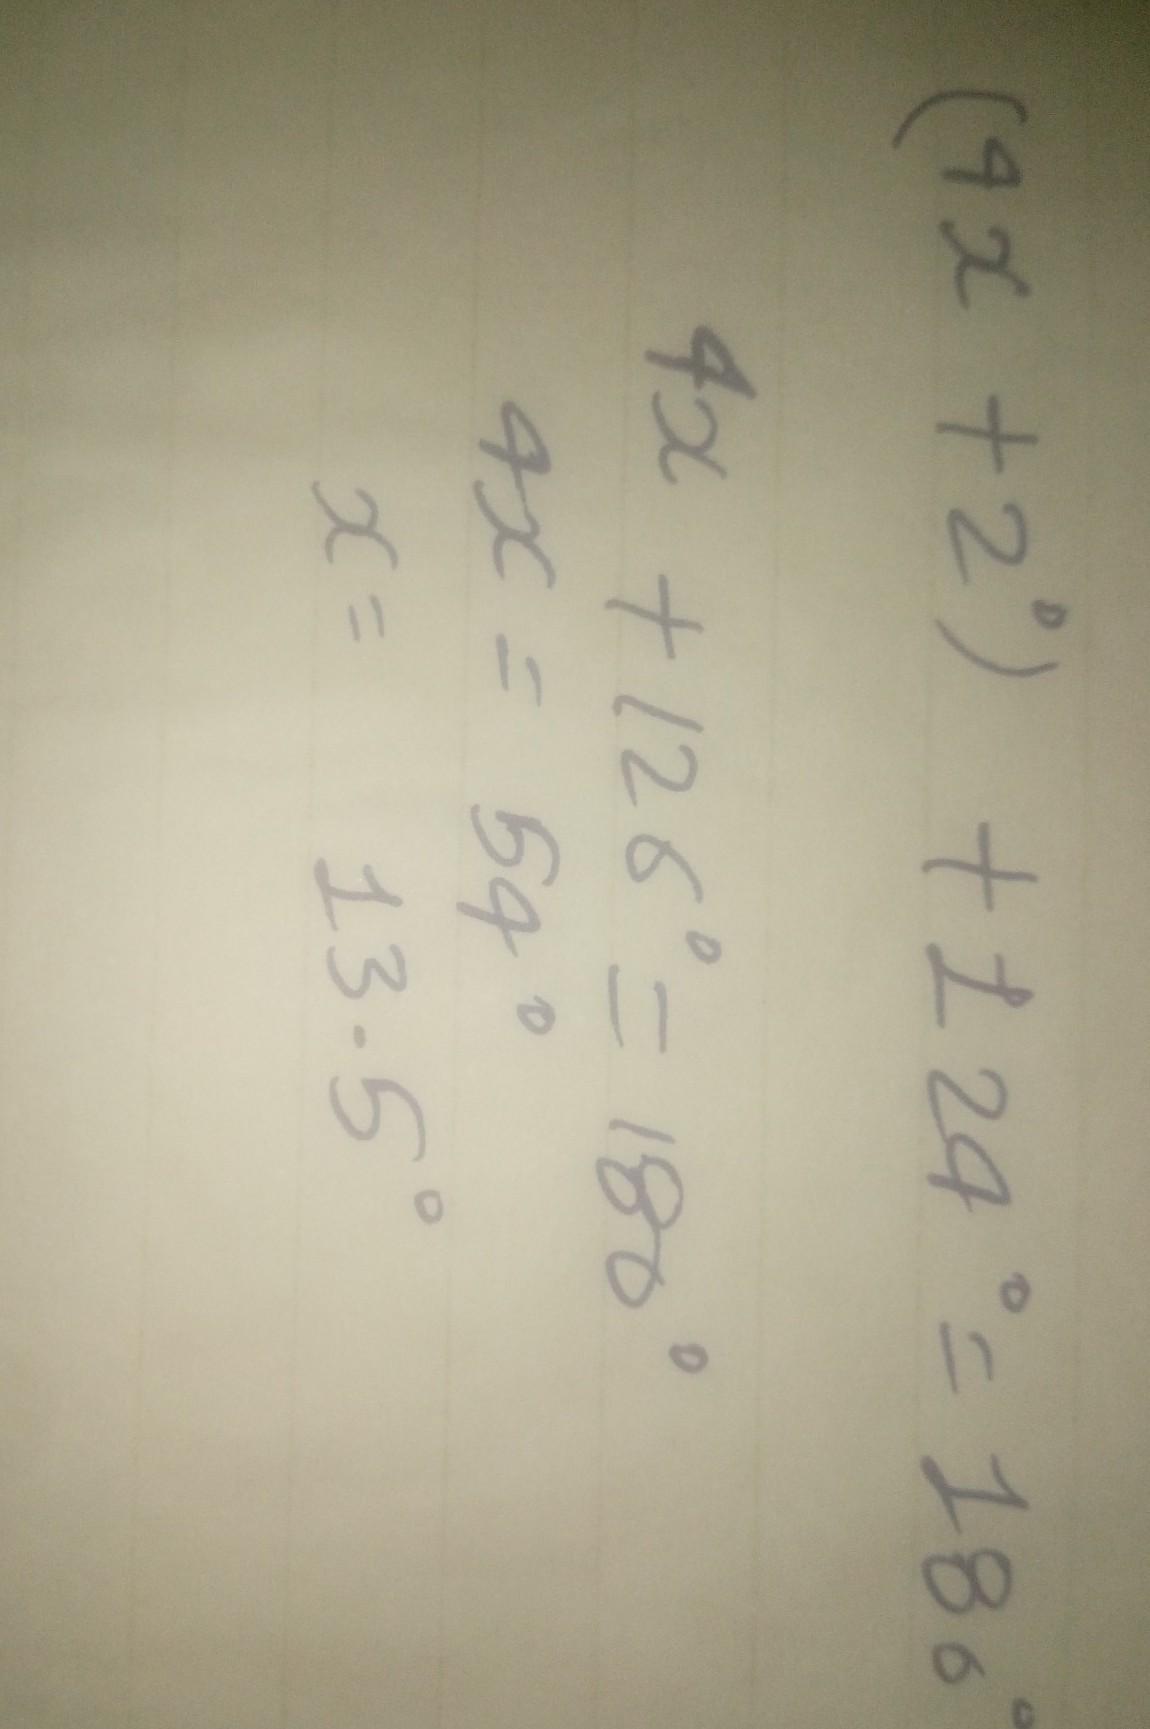
Given parallelogram ABCD,
find x.
A
B
(4x + 2)°
1249
C
D

Answers
Answer:
hey here is the correct answer
Answer:
x = 30.5
Step-by-step explanation:
The opposite angles of a parallelogram are congruent , then
4x + 2 = 124 ( subtract 2 from both sides )
4x = 122 ( divide both sides by 4 )
x = 30.5
classify the following graph as a cross-sectional study or a time-series study.
Answers
The terms "cross-sectional study" and "time-series study" refer to different types of research designs. A cross-sectional study collects data from a population at a specific point in time, whereas a time-series study collects data from the same population over an extended period.
Based on this definition, it is difficult to classify a graph as either a cross-sectional or time-series study without additional context.
A graph alone does not provide enough information about the research design. It would be best to refer to the accompanying study or research report to determine the type of study represented by the graph.
Therefore, the long answer to your question is that a graph cannot be classified as a cross-sectional or time-series study without further information about the research design.
Know more about the cross-sectional study here:
https://brainly.com/question/30552943
#SPJ11
To amend a country's constitution, 5 6 of the 52 states in that country must approve the amendment. If 44 states approve an amendment, will the constitution be amended
Answers
Answer: Yes. It will be amended
Step-by-step explanation:
Since 5/6 of the 52 states in a country must approve the amendment before the country's constitution is amended, then the number of states that must approve it will be:
= 5/6 × 52
= 43.33
= 43 approximately
Since 44 states approve an amendment, the constitution be amended since it's more than 5/6 of the 52 states.
Helppppppppppppppp !!!!!!

Answers
Answer:
\(\sqrt{2^{5} }\) is correct
Step-by-step explanation:
Add and round the answer to the nearest THOUSANDTHS place value
191.007+0.8215
Answers
Answer:
191.829
Step-by-step explanation:
191.007+0.8215=191.8285. But since you want to round it to the nearest thousandths place, you have 191.829
Answer:
191.8290
Step-by-step explanation:
191.007 + 0.8215 = 191.8290
0.8215
0.0097
+______
0.8285
then add 191. to .8285, creating 191.8285, then rounding to the nearest thousandths, and in this case the thousandths is a 5, which means we always round up. That gives us 191.8290.
p.s. there's no need for the zero at the end
Which property of addition is shown below? a bi c di = a c bi di identity property associative property commutative property inverse property
Answers
The commutative property of addition is shown here a+bi+c+di = a+c+bi+di which is the correct answer.
What is commutative property?The commutative property states that an expression of the form (A + B) can be solved as (B + A) by an addition operation that does not change the result.
This property applies to multiplication also.
We have the given expression:
a+bi+c+di = a+c+bi+di
We have to identify the property of addition in the above expression.
Since we can say here that (bi+c) is expressed as (c+bi).
The commutative property of addition states that the numbers can be added in any order.
Mathematically, it states that a+b = b+a.
Here, (bi+c) can be replaced by (c+bi), whether 'b' is added to 'ci' or 'ci' is added to 'b', the result is always the same.
Therefore, the commutative property of addition is the correct answer
Learn more about the commutative property;
https://brainly.com/question/27325958
Answer:
commutative property
Step-by-step explanation:
edge2020
Can someone explain how to do this?

Answers
i cant give you the answer but i know how u can figure it out, go to g00gle calculator or look up "Algebra Calculator"....you wont regret it!!!
you have to try to find a fraction that is similar to the first. so 7/14 and 5/10, 6/12, 4/8, 3/6, 2/4, 1/2, so on and so forth. so x can equal any number related to 7/14.
Alice is willing to spend $30 on a pair of jeans and has a coupon for $10 off she found online. She selects and purchases a $35 pair of jeans, pre-discount. Determine whether this would create a producer or consumer surplus and calculate the ensuing surplus.
Answers
Consumer surplus $5 as we solve the Q by given data
Consumer surplus is the difference between the consumer's willingness to pay and the price of the commodity.
Consumer surplus in economics, also called social surplus or consumer surplus, is the difference between the price a consumer pays for a commodity and the price the consumer is willing to pay in exchange for giving it up.
Producer surplus is the difference between the price of a commodity and the lowest price at which a seller is willing to sell it.
Consumer Surplus = Willingness to Pay - Price of the Good.
Item Price = $35 - $10 = $25
$30 - $25 = $5
Producer surplus is the difference between the price of a commodity and the lowest price at which a seller is willing to sell it.
know more about consumer surplus click here;
https://brainly.com/question/14852681
#SPJ4
1. u+47=8
u=?
i just want to know how to solve a question like this
Answers
Step-by-Step Explanation:
=> u + 47 = 8
First we have to shift 47 to the RHS. When we do that +47 becomes negative on the RHS.
=> u = 8 - 47
Now subtract 47 from 8 which will result in -39 because 47 > 8.
=> u = -39
The garden club at Central Middle School is planting a flower bed. A scale drawing of the flower bed is shown. The scale is 1 in. : 2 ft.
Answers
Answer:
16 and 12
Step-by-step explanation:
A.1 IN=2FT
8IN =2(8)FT
= 16
B.1 IN=2FT
6IN=2(6)FT
=12 FT
Find a point-slope form for the line with slope = 1/5 and passing through the point
(- 2, -3).
The equation of the line in point-slope form is…
Answers
Answer:
y+3= 1/5 (x+2)
Step-by-step explanation:
The point slope form looks like this.
y - y1 = m (x - x1)
the m represent slope and (x1, y1) are the coordinates of the point that the line passes through.
will someone plz help me

Answers

a pumpkin farmer collects 20 pumpkins randomly sampled from his pumpkin patch and weighs them. the mean weight of the pumpkins is 26 lb. he wonders whether the weight of his pumpkins follows a normal distribution. which answers are clear signs that the pumpkin weights are not normally distributed?
Answers
Outliers or extreme skewness in the distribution of pumpkin weights would be clear signs that they are not normally distributed.
There are several signs that can indicate the pumpkin weights are not normally distributed based on the farmer's sample of 20 pumpkins with a mean weight of 26 lb.
Skewed Distribution: If the distribution of pumpkin weights is noticeably skewed, it suggests a departure from normality. Positive skewness occurs when the tail of the distribution is stretched towards higher values, indicating a higher number of lighter pumpkins.
Negative skewness is the opposite, with a tail stretched towards lower values, suggesting a higher number of heavier pumpkins.
Outliers: The presence of extreme values that deviate significantly from the majority of the data can be a clear sign of non-normality. If there are a few pumpkins with exceptionally high or low weights compared to the rest, it indicates the presence of outliers and a potential departure from a normal distribution.
Bimodal or Multimodal Distribution: If the pumpkin weights exhibit multiple peaks or modes instead of a single bell-shaped curve, it suggests a non-normal distribution. This could indicate the presence of distinct subpopulations of pumpkins with different weight ranges.
Non-linear Patterns: If there is a distinct non-linear pattern or trend in the data, it deviates from a normal distribution. For example, if there is a systematic increase or decrease in weights as the pumpkin size increases, it suggests a departure from normality.
Departure from the 68-95-99.7 Rule: In a normal distribution, approximately 68% of the data falls within one standard deviation from the mean, 95% falls within two standard deviations, and 99.7% falls within three standard deviations. If the sample data significantly deviates from these percentages, it indicates a departure from normality.
It is important to note that these signs alone do not definitively prove that the pumpkin weights are not normally distributed. Further statistical tests such as the Shapiro-Wilk test, Anderson-Darling test, or visual inspections of a histogram, Q-Q plot, or kernel density plot can provide more evidence to assess the distributional assumption.
For more question on weights visit:
https://brainly.com/question/30237339
#SPJ8
Simplify this expression.
–6w + (–8.3) + 1.5+ (–7w)
Answers
The simplified form of the expression -6w + (–8.3) + 1.5+ (–7w) is -13w - 6.8.
What is the simplified form of the expression?Given the expression in the question;
-6w + (–8.3) + 1.5+ (–7w)
To simplify, first remove the parenthesis
Note that;
- × + = -- × - = ++ × + = +-6w + × - 8.3 + 1.5 + × - 7w
-6w - 8.3 + 1.5 - 7w
Next collect and add like terms
-6w - 7w - 8.3 + 1.5
Add -6w and -7w
-13w - 8.3 + 1.5
Add -8.3 and 1.5
-13w - 6.8
Therefore, -13w - 6.8 is the simplified form.
Learn more about expressions here: https://brainly.com/question/28959918
#SPJ1
Write a possible equation for a cosine function that has a maximum point at (1, 11) and a minimum point at (8, 3).
Answers
M = A + |B| is the function's highest possible value. When sin or cos x equals 1, this maximum value is reached. m = A |B| is the function's lowest possible value. If either cos x or sin x is equal to 1, this minimum will be reached.
How do you find the maximum and minimum of a cosine function?The sine and cosine functions are graphed; to find the values of the sine and cosine functions for a variety of various degrees of angles, use a calculator, computer, or a collection of trigonometry tables (or radian).Because the sine and cosine functions have periods of 2, the patterns are continually repeated to the left and right.The sine and cosine functions can have a number of additional terms and factors added to them, changing how they look.The graph of the sine functions can be vertically shifted by adding the extra term A to the equation y = A + sin x. The sine function can have different amplitudes because to the additional element B in the equation y = B sin x. The graph's highest and minimum values, or one half of those values, make up the amplitude, or | B |, which is the maximum deviation from the x-axis. Both y = A + B sin x and y = A + B cos x are produced by combining these values. The minimum and maximum values for these two functions are specified by the following formulas. M = A + |B| is the function's highest possible value. When sin or cos x equals 1, this maximum value is reached. m = A |B| is the function's lowest possible value.If either cos x or sin x is equal to 1, this minimum will be reached.Example :
Draw the y = 1 + 2 sin x function on a graph. Which values represent the function's maximum and minimum?1 + 2 = 3 is the highest possible value. 1 + 2 = 1 is the minimum value.To Learn more About sin or cos refer To:
https://brainly.com/question/28160425
#SPJ1

The table represents a linear function. Write a rule for this function in the
form of y = mx + b. Then using your function rule find the missing output values.

Answers
Answer:
function is f(x) = x+6
and the missing outputs are 19, 24 and 27
a 2,500 kg bus traveling at 15.3 slams on the brakes and comes to rest in 1.62 seconds what is the acceleration of the bus?
Answers
Answer:
15.3 what unit men we need to know this things