The following table shows the number of hours some teachers in two schools expect students to spend on homework each week.
School A
9
14
15
17
17
7
15
6
6
School B
12
8
13
11
19
15
16
5
8
Part A: Create a five-number summary and calculate the interquartile range for the two sets of data. (5 points)
Part B: Are there any outliers present for either data set? Justify your answer mathematically. (5 points) (10 points)

Answers
Answer:
Part A: School A Interquartile range = 9.5. School B Interquartile range = 7.5
Part B: There are no outliers present for either data set.
Step-by-step explanation:
For Part A, school A interquantile range is 9.5. Five number summary of school A is minimum = 6, quarantine q1= 6.5, median = 14, quarantine q3 = 16, and maximum = 17. Calculate Q3-Q1 = 16 - 6.5 which gives you 9.5
For School B, the interquartile range is 7.5. Five number of summary of school B is minimum = 5, quarantine q1 = 8, median = 12, quarantine q3= 15.5, maximum = 19. IQR Range = Q3-Q1 = 15.5 - 8. Which gives you 7.5
For Part B: All the outcomes of school A in between the values of -7.75 and 30.25. So this means there is no outliers in school A. For school B, all the outcomes of school B in between the values of -3.25 and 26.75. So there are no outlines in school B.
Related Questions
The sparrow tennis team outscored its opponents 5:2 last season. If their opponents scored 40 points, how many points did The sparrows score?
Answers
Answer:
100?
Step-by-step explanation:
Answer:
100
Step-by-step explanation:
5/7/2/7*40
5/7*7/2*40
=100
What number is the smallest?
-1 or -0.5
Answers
Answer: -1
Consider the following signal as "original": x(t)=t 3cos(10πt)p2(t−1) for −2≤t≤5, where pT(t) is a rectangular pulse of duration T, denoted by p2(t−1)=u(t−1+2/2)−u(t−1−2/2)=u(t)−u(t−2) Plot the original function x(t) along with the sampled version x5(t), if the sampling period is defined as (a) ts=1 s (b) t S=0.1 s; (c) t s=0.09 s.
Answers
To plot the original function x(t) and its sampled versions, we need to consider different sampling periods and apply the sampling process.
The original function is given by:
x(t) = t * 3cos(10πt) * p2(t−1)
(a) For ts = 1s:
The sampling period is 1 second. We need to evaluate x(t) at every 1-second interval within the range -2 to 5.
Sampling points: -2, -1, 0, 1, 2, 3, 4, 5
Evaluate x(t) at each sampling point to get the corresponding sampled values x5(t).
(b) For ts = 0.1s:
The sampling period is 0.1 seconds. We need to evaluate x(t) at every 0.1-second interval within the range -2 to 5.
Sampling points: -2, -1.9, -1.8, ..., 4.9, 5
Evaluate x(t) at each sampling point to get the corresponding sampled values x5(t).
(c) For ts = 0.09s:
The sampling period is 0.09 seconds. We need to evaluate x(t) at every 0.09-second interval within the range -2 to 5.
Sampling points: -2, -1.91, -1.82, ..., 4.91, 5
Evaluate x(t) at each sampling point to get the corresponding sampled values x5(t).
Plot the original function x(t) and the sampled versions x5(t) on separate graphs for each sampling period, showing the sampling points and the waveform.
learn more about original function here
https://brainly.com/question/5245372
#SPJ11
which of the numbers 4370, 1885, 3185 cannot be represented as a sum of squares of two relatively prime integers?
Answers
Among the given numbers, only 4370 cannot be represented as a sum of squares of two relatively prime integers due to the presence of a common prime factor.
To determine whether a number can be represented as a sum of squares of two relatively prime integers, we need to consider its prime factorization.
Let's analyze each number:
4370:
The prime factorization of 4370 is 2 * 5 * 19 * 23. We observe that 4370 contains the prime factor 2, which is common to both 2 and 23. Therefore, 4370 cannot be represented as a sum of squares of two relatively prime integers.
1885:
The prime factorization of 1885 is 5 * 13 * 29. Here, there are no common prime factors, and all the prime factors are unique. Hence, 1885 can be represented as a sum of squares of two relatively prime integers.
3185:
The prime factorization of 3185 is 5 * 7 * 457. Similar to 1885, 3185 does not have any common prime factors, making it possible to represent it as a sum of squares of two relatively prime integers.
Learn more about squares here:
https://brainly.com/question/14198272
#SPJ11
1. Please answer the following questions in detail:
a) What are the major differences between Normal and Log-normal
distribution?
b) How do you select which one would fit better to your
data?
Answers
The Normal distribution is symmetric and ranges from negative to positive infinity, while the Log-normal distribution is skewed and only takes positive values. To select the better fit for data, consider characteristics (positivity and skewness favor Log-normal, symmetry favors Normal), hypothesis testing, visualization, and statistical tests.
Let's analyze each section separately:
a) The major differences between the Normal and Log-normal distributions are:
Normal Distribution: The Normal distribution, also known as the Gaussian distribution, is a symmetric probability distribution that is defined by its mean (μ) and standard deviation (σ). It follows a bell-shaped curve and is often used to model naturally occurring phenomena. The range of values extends from negative infinity to positive infinity.
Log-normal Distribution: The Log-normal distribution is a skewed probability distribution that arises when the logarithm of a random variable follows a normal distribution. It is characterized by its parameters mu (μ) and sigma (σ) of the underlying normal distribution. Unlike the Normal distribution, the Log-normal distribution only takes positive values.
b) Selecting which distribution fits the data better depends on the nature of the data and the research question at hand. Here are a few considerations:
1. Data Characteristics: If the data consists of positive values and the distribution appears to be skewed, the Log-normal distribution might be more appropriate. On the other hand, if the data is symmetric and unbounded, the Normal distribution may be a better fit.
2. Hypothesis Testing: If you have a specific hypothesis to test or a theoretical justification for choosing one distribution over the other, it is advisable to use that distribution.
3. Visualization: Plotting the data and comparing it to the shapes of the Normal and Log-normal distributions can provide visual insights into which distribution aligns better with the data.
4. Statistical Tests: Statistical tests such as the Kolmogorov-Smirnov test or the Anderson-Darling test can be used to assess the goodness-of-fit for each distribution and determine which one provides a better fit to the data.
In summary, selecting the appropriate distribution involves considering the characteristics of the data, the research question, and statistical tests. Visualization and hypothesis testing can further aid in determining the best fit distribution.
To know more about goodness-of-fit tests, refer here:
https://brainly.com/question/32668212#
#SPJ11
Complete the equation to show the relationship between the number of buses, x, and the number of people that can be transported, y. At this rate, how many people can be transported on 40 buses?
Answers
Answer:
\(y = 40\cdot k\)
Step-by-step explanation:
Let suppose that each bus has the same capacity and exists a direct proportionality between the amount of people that is transported and the number of buses:
\(y \propto x\)
\(y = k \cdot x\)
Where \(k\) is the proportionality constant, which is equivalent to the maximum capacity of each bus. In that case, the quantity of people that is transported on 40 buses is:
\(y = 40\cdot k\)
Answer:
The first answer is ''y=45 x''
1800 people for the second one
which of the matters accupies more space assuming similar number of molecules
Answers
The matter that occupies more space, assuming a similar number of molecules, is the one that has a lower density than the other.
The space occupied by a matter depends on its density. The higher the density of the matter, the more space it occupies. Density can be defined as the amount of matter present per unit volume.
The matter that occupies more space is the one that has a lower density than the other, assuming a similar number of molecules. Density is a key physical property that helps scientists identify a substance.
The density of a substance remains constant at a given temperature and pressure. Density is important for many applications such as calculating the weight of a particular amount of material, measuring the concentration of a solution, and determining whether a substance will float or sink in a liquid.
The mass of the substance will determine the density of the substance. The relationship between mass, volume, and density can be given by the following formula:
Density = Mass/VolumeIf we have the same number of molecules of two different substances, the substance with the lower density will occupy more space. Let's say we have a balloon with helium gas and another balloon with oxygen gas, and both balloons have the same number of molecules.
Since helium gas has a lower density than oxygen gas, the balloon with helium gas will occupy more space than the balloon with oxygen gas.
for more such questions on molecules
https://brainly.com/question/30337264
#SPJ8
Which of these tables represents a function?
W.
X.
Y.
Z.
Answers
Answer:
8
Step-by-step explanation:
Roger jarred 15 liters of jam after 2 days. How much jam did Roger jar if he spent 6 days making jam?
Answers
Answer: 45 liters
Step-by-step explanation:
If Roger jars 15 liters of jam in 2 days, we can divide to see how much liters of jam Roger can jar in 1 day. We can divide 15 by 2 to find how much jam can be jarred in one day.
15 / 2 = 7.5.
Roger can jar 7.5 liters of jam every day.
Now we can multiply 7.5 by 6 to find how much jam Roger can jar at the end of 6 days.
7.5 x 6 = 45.
Therefore, Roger can jar 45 liters of jam in 6 days.
There are 4 triangles and 2 circles. What is the simplest ratio of circles to triangles?
Answers
Answer:1:2
Step-by-step explanation:
it is this answer because you have 2 circles for 4 triangles, you can simplify that by dividing each number by 2 and you get 1 and 2
Answer:
1:2
Step-by-step explanation:
it would originally be 2:4 But both are divisible by 2 so they simplify down to 1:2........2÷2=1 and 4÷2=2 since the ratio has to be circles to triangle the 1 goes first then the 2
+
What is the quotient when (16x4 + 40x3 - 24x2) is divided by 8x??
OA.
2x + 5x-3
OB. 2x + 3x-5
OC. 2x - 5x+5
D. 2x3 + 5X-3
+
Relat
Next

Answers
Answer: \(2x^{2} + 5x -3\)
Step-by-step explanation:
Find the quotient of \(\frac{16x^4+40x^3-24x^2}{8x^2}\)
Step 1: Break down the polynomial equation
\(\frac{16x^4}{8x^2}\) + \(\frac{40x^3}{8x^2}\) - \(\frac{24x^2}{8x^2}\)
Step 2: Divide each piece by dividing the coeffients and subtracting the variables.
16 ÷ 8 = 2
\(x^{4}\) - \(x^{2}\) = \(x^{2}\) → 2\(x^{2}\)
40 ÷ 8 = 5
\(x^{3}\) - \(x^{2}\) = \(x\) → 5\(x\)
- 24 ÷ 8 = - 3
\(x^{2}\) - \(x^{2}\) = 1 → - 3
Step 3: Put the polynomial together
2\(x^{2}\) + 5\(x\) - 3
13. Given the situation below, describe a possible random sample:

Answers
Answer: This question is asking for your answer, so it is asking for a possibility of what the person responds with.
Step-by-step explanation:
Here is an example:
The school takes a survey on what snacks they should add
Sample:
I think that they should add healthier snacks like carrots.
Put
–
44,
–
95, and
–
27 in order from least to greatest
Answers
Answer:
27,44,95
Step-by-step explanation:
These numbers are in order from least to greatest, hope this helped!
Answer:
27, 44, 95
Step-by-step explanation:
Since 27 is smaller than 44 and 95 it goes first and since 95 is bigger than 27 and 44 it goes at the end and 44 is in the middle
Consider the slopes of the sides of this polygon.
w
What can be concluded about the polygon? Check all
that apply.
The slopes of side w and side z are reciprocals.
Opposite sides are parallel because their slopes
are opposite reciprocals.
1
Slope of side w=
Z
Slope of side z=-4
y
Oy 1 x because (4)
=-1.
Slope of side x = 1
Slope of side y=-4
w|| x because they have the same slope.
The polygon is a rectangle.
Answers
Answer: C, D, and E are the answers
Answer:
Anwer is C, D, E
Step-by-step explanation:
Slopes of Parallel and Perpendicular Instructions:
Question 1: -3, 1/3
Question 2: y = 4x + 4
Question 3: 1/4, -4, 1/4, -4
Question 4: C, D, E
to the nearest tenth of a kilometer, how many kilometers are in a mile?
Answers
Answer:
1.6 kilometers
Step-by-step explanation:
Umm... sorry...
I can't think of an explanation.
I memorized the answer (because I do track and field)
Well, feel free to tell me if I did anything wrong! :)
A vision insurance company selects a SRS of 300 clients who wear contact lenses. They randomly assign 200 clients to the experimental group to receive an app that promotes contact lens hygiene. The remaining 100 clients form the control group. Suppose that without the app, 96%, percent of their clients with contact lenses would have healthy eyes for the year, and that with the app, 99%, percent would have healthy eyes.
After a year, the insurance company looks at the difference (Experimental−Control) between the proportions of clients with healthy eyes in each group.
What will be the shape of the sampling distribution of the difference in sample proportions, and why?
A
Approximately normal, because we expect 288 healthy and 12 not-healthy in both groups, and all of these counts are at least 10.
B
Approximately normal, because we expect 192 healthy and 20 not-healthy eyes for the experimental group, and 96 and 40 for the control group, and all of these counts are at least 10.
C
Not normal, because we expect fewer than 10 clients with healthy eyes in both groups.
D
Not normal, because we expect fewer than 10 clients with not-healthy eyes in both groups.
Answers
Answer:
NO, its D: Not normal, because we expect fewer than 101010 clients with not-healthy eyes in both groups.
Step-by-step explanation:
.
75% of days is 15 days
Answers
In the diagram, If mÐAOB = (3x)° and mÐBOC = (5x – 6)°, then what is the value of x?
Answers
Answer:
X=12
Step-by-step explanation:
Given, OC⊥AD , ∠AOB=3x° & ∠BOC=(5x-6)° .
We Know ∠AOC=90
& ∠AOC=∠AOB + ∠BOC
90 = 3x + (5x-6)
90+6 = 8x
8x=96⇔x=12
(For Diagram,Please find in Attachment)

50 points!!
Eugene can type 55 words per minute. Allen can
type 80 words in 2 minutes. If Eugene and Allen
each type for 30 minutes, how many more words
will Eugene type?
A.
45
C.
900
B.
450
D. 1.200
Answers
Answer: B. 450
Step-by-step explanation:
Eugene can type 55 words per minute, so in 30 minutes he will type 55 * 30 = 1650 words.
Allen can type 80 words in 2 minutes, so in 30 minutes he will type 80 * 15 = 1200 words.
To find out how many more words Eugene will type than Allen, we subtract Allen's total from Eugene's total:
1650 - 1200 = 450 words
So, Eugene will type 450 more words than Allen in 30 minutes. Therefore the answer is B. 450
Answer:
B. 450
Step-by-step explanation:
We can find how many words each person types by multiplying how fast they type by how long they get to type (30 minutes).
Eugene:
\( \frac{55 \: words}{1 \: minute} \times 30 \: minutes \: = 1650 \: words\)
Allen:
\(\frac{80 \: words}{2 \: minutes} \times 30 \: minutes \: = 1200 \: words\)
we can find how many more words Eugene types using subtraction
\(1650 - 1200 = 450\)
Eugene types 450 more words
in wereda election where four candidates appeared for election, the winning candidate received 36,000 votes which represented 45% of the electorate. The other three candidates received 25%, 20% and 6% of votes each. How many of the electrorate voted?
Answers
Let's see
Total votes be x
45% of x=36000.45x=3600x=3600/0.45x=8000Now total percentage of vote
45+20+25+6=96%Not voted=4%
Find not voted
0.04(8000)320Total voted
8000-3207680Answer:
73649 of 80000 (or 91.8%)
Step-by-step explanation:
Note: An electorate is a person who is entitled to vote in an election - it does not necessarily mean they have voted in the election.
If 36000 votes represents 45% of the electorate (note: it does not say this figure represents 45% of the votes), then the total number of electorates is:
\(\implies \sf \dfrac{36000}{45}\times 100=80000\)
If three candidates received 25%, 20% and 6% of the votes, then the winning candidate received:
⇒ 100% - 25% - 20% - 6% = 49% of the votes
If the winning candidate received 36,000 votes, then:
⇒ 49% of the votes = 36,000 votes
Therefore, the total number of votes is:
\(\implies \sf \dfrac{36000}{49}{ \times 100=73469\)
To find the percentage of electorates that voted:
\(\implies \sf \dfrac{73469}{80000} \times 100=91.8\% \:\: (1\:d.p.)\)
FILL IN THE BLANK. A good way to get a small standard error is to use a ________.1. Large sample2. Large population3. Repeated sampling4. Small sample5. Small population
Answers
A good way to get a small standard error is to use a Large sample. the correct answer is option 1.
The standard error is a measure of the variability of the sampling distribution of a statistic. A smaller standard error indicates that the statistic is more precise and is likely closer to the true population value.
One way to obtain a smaller standard error is to use a larger sample size. This is because a larger sample size tends to produce a more accurate estimate of the population parameter, with less variability. Therefore, option 1, "Large sample," is the correct answer.
The other options, such as a large population, repeated sampling, small sample, or small population, are not necessarily related to obtaining a small standard error.
To learn more about standard error click on,
https://brainly.com/question/13179711
#SPJ11
Q1: Use simple exponential smoothing with a = 0.75 to forecast the water pumps sales for February through May. Assume that the forecast for January was for 25 units. [4 marks) Month January February March April Air-condition sales 28 72 98 126
Answers
Therefore, using simple exponential smoothing with a = 0.75, the forecast for water pump sales for February through May are:- February: 26.5 units, March: 37.63 units, April: 72.66 units.
To use simple exponential smoothing with a = 0.75, we first need to calculate the forecast for January:
F1 = 25 (given)
Next, we calculate the forecast for February using the formula:
F2 = a * Y1 + (1 - a) * F1
F2 = 0.75 * 28 + 0.25 * 25
F2 = 26.5 (rounded to one decimal place)
We repeat this process for each month, using the previous month's forecast and the actual sales data for the current month. The results are as follows:
Month Actual Sales Forecast
-------------------------------------
January 28 25
February 72 26.5
March 98 37.63
April 126 72.66
- May: 101.17 units
Hi, I'd be happy to help you with your question. To use simple exponential smoothing with a smoothing constant α = 0.75 to forecast the water pump sales for February through May, given that the forecast for January was 25 units, follow these steps:
Step 1: Start with the given forecast for January, which is 25 units.
Step 2: Calculate the forecast for February using the formula:
Forecast_February = α * (Actual_January) + (1 - α) * Forecast_January
Step 3: Calculate the forecast for March using the formula:
Forecast_March = α * (Actual_February) + (1 - α) * Forecast_February
Step 4: Calculate the forecast for April using the formula:
Forecast_April = α * (Actual_March) + (1 - α) * Forecast_March
Step 5: Calculate the forecast for May using the formula:
Forecast_May = α * (Actual_April) + (1 - α) * Forecast_April
Please note that you have provided sales data for air-conditioning sales, but the question is about water pump sales. If you meant to ask about air-conditioning sales, you can use the given sales data to calculate the forecasts for February through May. If you need help with water pump sales, please provide the correct sales data for January through April, and I will gladly help you with the calculations.
To know more about the function visit :
https://brainly.com/question/11624077
#SPJ11
If the scale of the model is 1 inch = 6 feet, how many inches will the model be of a 90-foot airplane?
Answers
Answer:
15
Step-by-step explanation:
If in the model 1 inch = 6 feet and there is a 90 foot inch airplane we would divide 90 / 6 to find out how many inches there would be in the model. 90/6=15.
Data that's displayed randomly on a scatter plot graph illustrates (please help asap!)
positive correlation.
negative correlation.
none of these.
no correlation.
Answers
Anyone know the answer?

Answers
300/6
Supposed we take a 0 off 300
30/6=5
Now add back the 0
And you get 50.
How to write the algebraic expression (2)(t) in words
Answers
Answer:
"The number 8 multiplied by a number. "
"The product of 8 and a number"
"A number times the number 8"
Step-by-step explanation:
This is a long one,
You are going to write the expression using "key words"
Addition: sum, more than, plus, increase, add, older than.
Examples: 4+7
"The sum of 4 and 7"
"7 more than the number 4"
"The number 4 increased by 7"
Etc....
Subtraction: minus, less, subtract, decrease, younger than, and lowered.
Example: 9 - 2
"The number 9 decreased by 2"
"The number 2 younger than 7"
"The number 7 minus 2"
Etc....
Multiplication: times, product, twice, doubled, multiplied, and of.
Example: 4 × 5
"The number 4 multiplied by 5"
"The product of the numbers 4 and 5"
"5 times the number 4"
Etc...
Division: divided by and divided into and Quotient. Pay close attention to the order in which it is written.
Examples: 6 / 3
"The number 6 divided by 3"
"3 divided into the number 6"
Or
"The quotient of the numbers 3 into 6"
Ect...
Expressions with More Than One Operation example:
8y + 14 ...
You could say:
The sum of 8 times a number and 14.
When referring to unknown number i.e. x, y, n, v... you may refer to it a "a number"
Hmmm, best way I can describe it. :)
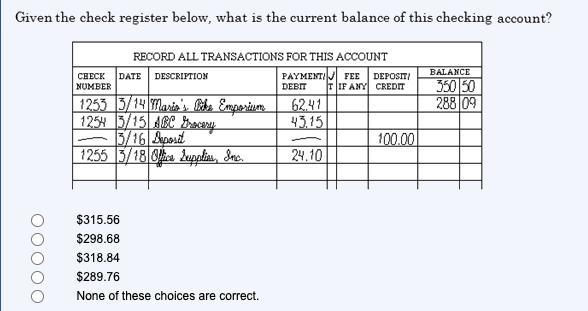
WILL MARK BRAINLIEST IF SOMEONE HELPS ME OUT ON THIS, MUST GET IT RIGHT!!!!
Answers
Answer:
non of these choice are correct
Step-by-step explanation:
288.09-43.15+100.00-24.10 = 320.84
Put these numbers in order from greatest to least.
0.32,1/2,0.66, and 0.45
Answers
Explanation
1/2 is .50 and you put the values in descending order
This is due like now!!!! Please help!!!
Look at the graph:
What is the slope?
Simplify your answer and write it as a proper fraction, improper fraction, or integer.

Answers
The surface area of a three-dimensional object is? This is a brainpop question, there is no picture, and tis a straight forward question
Answers
Answer:
What it is is basically when you take the area of every side of a three dimensional shape and then add it all together.
don't know if this is what you were looking for but I hope this helps.