The fish in a lake have weights that are normally distributed with a mean of 1.3 kg anda standard deviation of 0.2 kg.(a)Determine the probability that a fish which is caught weighs less than 1.4 kg. John catches 6 fish Calculate the probability that at least 4 of the fish weiehmore than 1.4 kg.(c) Determine the probability that a fish which is caught weighs less than 1 kg.given that it weighs less than 1.4 kg
Answers
The probability that a fish which is caught weighs less than 1 kg given that it weighs less than 1.4 kg is 0.0965.
(a) The probability that a fish which is caught weighs less than 1.4 kg can be found using the standard normal distribution as follows:
z = (x - mu) / sigma
z = (1.4 - 1.3) / 0.2
z = 0.5
Using a standard normal distribution table or calculator, we can find that the probability of z being less than 0.5 is approximately 0.6915. Therefore, the probability that a fish which is caught weighs less than 1.4 kg is 0.6915.
(b) The weight of each fish is independent of the weight of the other fish. Therefore, the probability that at least 4 of the fish weigh more than 1.4 kg can be found using the binomial distribution as follows:
n = 6 (the number of trials)
p = P(X > 1.4) = 1 - P(X < 1.4) = 1 - 0.6915 = 0.3085 (the probability of success in each trial)
k = 4, 5, 6 (the number of successes)
Using a binomial distribution table or calculator, we can find the probabilities of getting 4, 5, or 6 successes out of 6 trials, and then add them up to get the probability of at least 4 successes:
P(X >= 4) = P(X = 4) + P(X = 5) + P(X = 6)
= (6 choose 4) * 0.3085^4 * 0.6915^2 + (6 choose 5) * 0.3085^5 * 0.6915 + (6 choose 6) * 0.3085^6
= 0.0675
Therefore, the probability that at least 4 of the fish weigh more than 1.4 kg is 0.0675.
(c) The probability that a fish which is caught weighs less than 1 kg and less than 1.4 kg can be found using Bayes' theorem:
P(X < 1 | X < 1.4) = P(X < 1 and X < 1.4) / P(X < 1.4)
= P(X < 1) / P(X < 1.4)
To find P(X < 1), we can use the standard normal distribution as follows:
z = (x - mu) / sigma
z = (1 - 1.3) / 0.2
z = -1.5
Using a standard normal distribution table or calculator, we can find that the probability of z being less than -1.5 is approximately 0.0668.
To find P(X < 1.4), we already calculated it in part (a) as 0.6915.
Therefore, the probability that a fish which is caught weighs less than 1 kg given that it weighs less than 1.4 kg is:
P(X < 1 | X < 1.4) = 0.0668 / 0.6915
= 0.0965 (rounded to four decimal places)
To learn more about distribution, refer below:
https://brainly.com/question/31197941
#SPJ11
Related Questions
PLEASE HURRY TEN MINUTES MAX BRAINLLEST WILL BE GIVEN
The base of a parallelogram is 3.2 centimeters and the height is 1.8 centimeters. What is the area of the parallelogram? Do not round your answer.
A = cm 2
Answers
Answer:
5.76
Step-by-step explanation:
Formula bh
3.2 x 1.8=5.76
Answer:5.76cm²
Step-by-step explanation:
GIVING 50 PONTS TO THE CORRECT ANSWER!! NO LINKS!! ANSWER ALL 4

Answers
Answer:
See below
Step-by-step explanation:
The measure of all the arcs can be obtained by using 'Central angle and its corresponding arc theorem'.
1. The measure of arc AD is \( \boxed {105}\degree \)
2. The measure of arc ABC is \( \boxed {205}\degree \)
3. The measure of arc ADB is \( \boxed {190}\degree \)
4. The measure of arc BD is \( \boxed {85}\degree \)
a zoo sponsored a one-day contest to name a new baby elephant. zoo visitors deposited entries in a special box between noon and 8 p.m. . the number of entries in the box t hours after noon is modeled by a differentiable function e for . values of , in hundreds of entries, at various times t are shown in the table above. (a) use the data in the table to approximate the rate, in hundreds of entries per hour, at which entries were being deposited at time . show the computations that lead to your answer. (b) use a trapezoidal sum with four subintervals given by the table to approximate the value of . using correct units, explain the meaning of in terms of the number of entries. (c) at 8 p.m., volunteers began to process the entries. they processed the entries at a rate modeled by the function p, where hundred of entries per hour for . according to the model, how many entries had not yet been processed by midnight ? (d) according to the model from part (c), at what time were the entries being processed most quickly? justify your answer?
Answers
Approximately 200 entries per hour were being deposited at 5pm, 2400 entries were deposited between noon and 8pm, 800 entries had not yet been processed by midnight, and entries were being processed most quickly at 8pm.
a) At 5pm, the rate at which entries were being deposited can be approximated by taking the difference between the number of entries at that time and the previous time, 4pm. This is (400-200) / (5-4) = 200 entries per hour.
b) The value of the trapezoidal sum can be approximated by taking the average between the upper and lower boundaries of the subintervals and then multiplying by the width of the intervals. In this case, (200+400+600+800)/2 x 4 = 2400 entries. This represents the total number of entries deposited between noon and 8 pm.
c) According to the model, the number of entries that had not yet been processed by midnight is p(8) = 800 entries.
d) According to the model, the entries were being processed most quickly at 8 pm, since it is the time where p(t) is at its maximum of 800 entries per hour.
Approximately 200 entries per hour were being deposited at 5pm, 2400 entries were deposited between noon and 8pm, 800 entries had not yet been processed by midnight, and entries were being processed most quickly at 8pm.
Learn more about trapezoidal sum here:
https://brainly.com/question/9328613
#SPJ4
ill mark brainliswt plss help

Answers
Answer:
z = 24
Step-by-step explanation:
35/30 = 7/6
28/7 = 4
6 x 4 = 24
28/24 = 7/6
Answer:
x = 24
Step-by-step explanation:
All you have to do is cross multiply like this..
30 x 28 = 35 x X
=
x = 30 x 28/35
30 x 28 = 840 / 35 =
24
So x is equal to 24
Hope this helps :)
help anyone im stuck?

Answers
Answer: 222.58 should be the correct answer.
Which number lines have points that represent additive inverses? Check all
that apply
-54-3 -2 -1 0
1
2
3
4 5
-513 2-1
0
1
2.
3
4 5
5 4 3 2 1
1
2
3 4
-54-3-2-1
0
1
2
3 4 5

Answers
Answer:
2nd and fourth one
Step-by-step explanation:
I just did it and if you look at both of them and if you look closely they each have a negative and a positive
) for pvc pipe in 2008, the authors estimate a failure rate of 0.0081 failures per 100 miles of pipe per day. consider a 100-mile-long segment of such pipe. what is the expected number of failures in 1 year (365 days)? based on thi
Answers
The expected number of failures in 1 year is 8.9948.
The authors calculate a failure rate for PVC pipe of 0.0081 per 100 miles of pipe per day in 2008. Think of a 100-mile section of this pipe.
(I)
Given;
Mean failures per day = 0.0081
So,
Expected number of failures in 1 year = 0.0081 * 365
= 8.9948
(II)
Poisson Distribution with λ = 8.9948 is given by:
\(P(x) =\frac{e^-^8^.^9^9^4^8 8.9948^0}{x!}\)
⇒ for x = 0, 1, 2,. . . .
P(At least 1 failure) = 1- P(X=0);
\(P(x) = \frac{e^-^8^.^9^9^4^8 8.9948^0}{0!} = \frac{0.00012*1}{1}\)
= 0.00012
So,
P(At least 1 failure) = 1 - 0.00012 = 0.99988
Hence, the expected number of failures in 1 year is 8.9948.
To learn more about Poisson Distribution click here:
brainly.com/question/17280826
#SPJ4
The temperature is -3.5 degrees Fahrenheit at 7:00 am. During the next 4 hours, the temperature decreases by -15.5 degrees. What is the temperature at 11:00 am?
Answers
Suppose 40% of American singers are Grammy award winners. If a random sample of size 743 is selected, what is the probability that the proportion of Grammy award winners will differ from the singers proportion by less than 3%
Answers
Using the normal distribution, it is found that there is a 0.905 = 90.5% probability that the proportion of Grammy award winners will differ from the singers proportion by less than 3%.
Normal Probability DistributionThe z-score of a measure X of a normally distributed variable with mean \(\mu\) and standard deviation \(\sigma\) is given by:
\(Z = \frac{X - \mu}{\sigma}\)
The z-score measures how many standard deviations the measure is above or below the mean. Looking at the z-score table, the p-value associated with this z-score is found, which is the percentile of X.By the Central Limit Theorem, for a proportion p in a sample of size n, the sampling distribution of sample proportion is approximately normal with mean \(\mu = p\) and standard deviation \(s = \sqrt{\frac{p(1 - p)}{n}}\), as long as \(np \geq 10\) and \(n(1 - p) \geq 10\).The proportion and the sample size are given, respectively, by:
p = 0.4, n = 743
Hence the mean and the standard error are given, respectively, by:
\(\mu = p = 0.4\)\(s = \sqrt{\frac{p(1 - p)}{n}} = \sqrt{\frac{0.4(0.6)}{743}} = 0.018\)The probability that the proportion of Grammy award winners will differ from the singers proportion by less than 3% is the p-value of Z when X = 0.43 subtracted by the p-value of Z when X = 0.37, hence:
X = 0.43:
\(Z = \frac{X - \mu}{\sigma}\)
By the Central Limit Theorem:
\(Z = \frac{X - \mu}{s}\)
\(Z = \frac{0.43 - 0.4}{0.018}\)
Z = 1.67
Z = 1.67 has a p-value of 0.9525.
X = 0.37:
\(Z = \frac{X - \mu}{s}\)
\(Z = \frac{0.37 - 0.4}{0.018}\)
Z = -1.67
Z = -1.67 has a p-value of 0.0475.
0.9525 - 0.0475 = 0.905.
0.905 = 90.5% probability that the proportion of Grammy award winners will differ from the singers proportion by less than 3%.
More can be learned about the normal distribution at https://brainly.com/question/4079902
#SPJ1
help please thank you
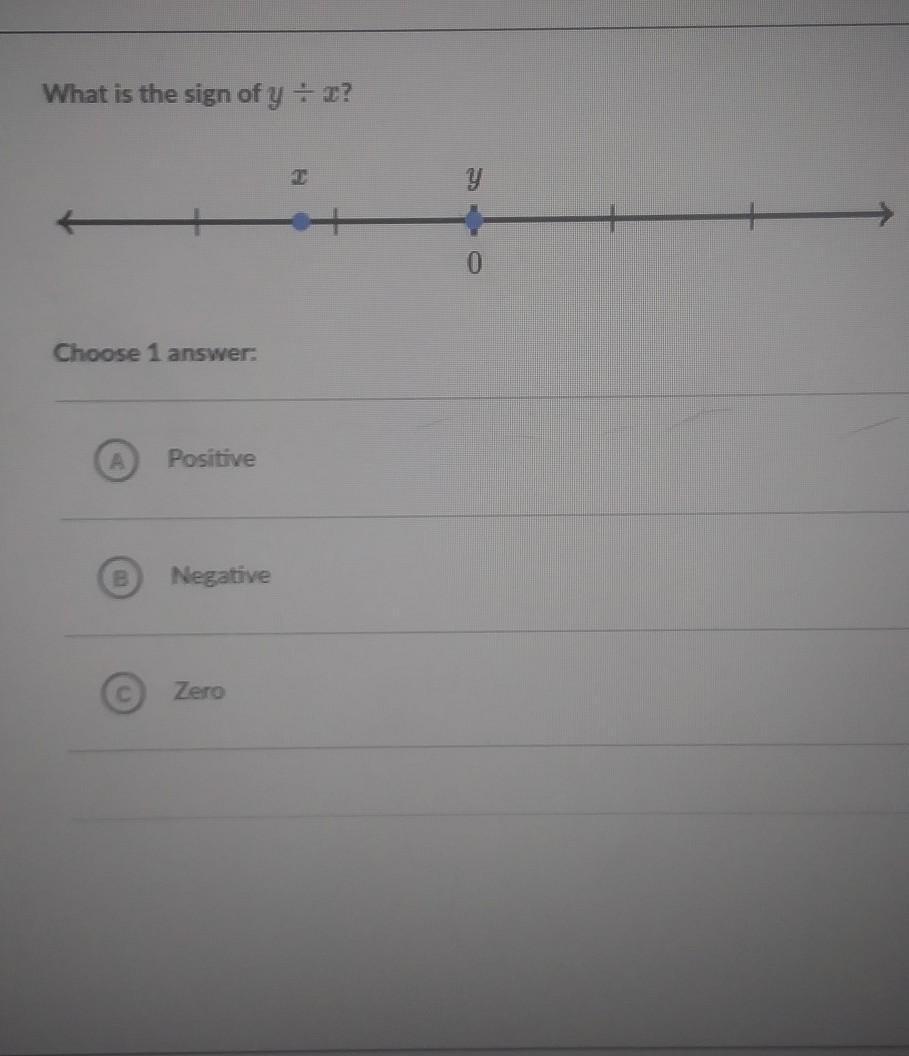
Answers
Answer:
Negative:)
Step-by-step explanation:
WILL GIVE BRAINLIST TO BEST ANSWER
A company rents motorcycles. Customer are charged a fixed amount plus a rate based on the number of miles the motorcycle is ridden. The company u es the function shown below to determine the total charges, in dollars,
for the customer.
f(x)=25+0.35x
of each part of the function is correct in the terms of the context
Select Yes or No to indicate if the meani
above.

Answers
Answer:
1. No
2. Yes
3. No
4. Yes
Step-by-step explanation:
x is equal to the number of miles, so it can't be the amount in dollars.
25 is the fixed amount because it does not change in the equation.
0.35 is not the fixed amount because it changes based on x.
f(x) is the total amount because that's what the equation is equal to.
Qualitative researchers use qualitative analysis computer programs to a. validate the findings. b. transcribe interview recordings. c. assign labels or codes to data. d. analyze the data for them.
Answers
Qualitative researchers use qualitative analysis computer programs to assign labels or codes to data.
What does qualitative research analysis entail?
To better comprehend ideas, opinions, or experiences, qualitative research entails gathering and evaluating non-numerical data (such as text, video, or audio). It can be utilized to uncover intricate details about a situation or to spark fresh study concepts.The following five categories can be used to categorize qualitative data analysis-
content evaluation To classify, summarize, and tabulate the data, verbal or behavioral data must be categorized. Analyzing stories. discourse examination. Framework examination. logical theory.Learn more about Qualitative research
brainly.com/question/13498255
#SPJ4
Using the graph above identify the constant of proportionality between the number of shirts and how much they cost? Hint: simplify your answer
A. K=80
B. K=20
C. K=10
D. k=8

Answers
Answer:
We conclude that the constant of proportionality between the number of shirts and how much they cost is:
k = 8
Hence, option 'D' is correct.
Step-by-step explanation:
We know that when 'y' varies directly with 'x', we get
y ∝ x
y = kx
k = y/x
where k is called the constant of proportionality
Given the points
(10, 80)(20, 160)(50, 400)For (10, 80)
substituting y = 80 and x = 10 in the equation
k = y/x
k = 80/10 = 8
For (20, 160)
k = y/x
k = 160/20 = 8
For (50, 400)
k = y/x
k = 400/50 = 8
It is clear that the value of k is the same for all the points.
Thus, the value of k = 8
Therefore, we conclude that the constant of proportionality between the number of shirts and how much they cost is:
k = 8
Hence, option 'D' is correct.
what is the probability that a randomly selected member of the u.s. labor force was unemployed in 2011?
Answers
The probability that a randomly selected member of the US labor force was unemployed in 2011 was approximately 0.087 or 8.7%.
This can be calculated by dividing the number of unemployed individuals in the labor force by the total number of individuals in the labor force. According to the US Bureau of Labor Statistics, there were 13.9 million unemployed individuals in the US labor force in 2011, out of a total labor force of 159.7 million. Dividing 13.9 million by 159.7 million gives a probability of approximately 0.087, or 8.7%.
Learn more about Probability:
https://brainly.com/question/13604758
#SPJ4
What graph represents the equation x=2

Answers
Option 1. The equation tells us that line is going through the x-axis at (2,0) in a straight line.
Prove that in , (0.5,1] is a relatively open set of [0,1], although it is not itself an open set.
Answers
R in (0.5,1] is a relatively open set of [0,1], although it is not itself an open set. An open set is a set in which every element has a neighborhood that is entirely within the set itself.
A set is open if all of its points can be isolated by an epsilon-ball that is entirely contained in the set. A set is relatively open in another set if it is the intersection of the larger set with an open set. It is also known as the relative topology.
The set R is defined as R = (0.5, 1]. It belongs to the interval [0, 1]. Proof that R in (0.5,1] is a relatively open set of [0,1], although it is not itself an open set.
The set R is not an open set since it does not contain any epsilon-ball around the point 0.5. However, it is a relatively open set in [0,1].
Let us consider the open set U in [0,1] defined as U = (0,1]. It can be observed that the intersection of U and [0.5, 1] is precisely R.
i.e., U∩[0.5,1]=R. Now, U is an open set as it contains an epsilon-ball around every point of U, that is entirely within U. Therefore, since R is the intersection of the open set U and [0.5, 1], it is also a relatively open set in [0,1].
In summary, R in (0.5,1] is a relatively open set of [0,1], although it is not itself an open set. Hence the proof.
The question should be:
Prove that in R, (0.5,1] is a relatively open set of [0,1], although it is not itself an open set.
To learn more about set: https://brainly.com/question/27358262
#SPJ11
What is the area of a rectangle WXYZ,with the vertices w(0,1),y(-1,8),z(-4,5) to the nearest square unit
Answers
The area of rectangle WXYZ with the given vertices, to the nearest square unit is: 24 square units
How to Find the Area of a Rectangle?Area of a rectangle = (length)(width)
Given the rectangle WXYZ with the following vertices:
W(0,1)X(3,4)Y(-1,8)Z(-4,5)The area of rectangle WXYZ = (length of WX)(length of XY).
Apply the distance formula d = \(\sqrt{(x_2 - x_1)^2 + (y_2 - y_1)^2}\) to find the length of WX and XY:
WX = √[(3−0)² + (4−1)²]
WX = √[(3)² + (3)²]
Length of WX = √18 units
XY = √[(3−(−1))² + (4−8)²]
XY = √[(4)² + (−4)²]
Length of XY = √32
Area of rectangle WXYZ = (√32)(√18) = 24
Area of rectangle WXYZ = 24 square units
Learn more about area of rectangle on:
https://brainly.com/question/25292087
#SPJ1
If you visit a county or state fair, you will pay a basic admission fee plus other fees if you want to enjoy any of the amusement rides. County and state fairs that price this way are using:
Answers
County and state fairs that charge a basic admission fee along with additional fees for amusement rides are using a pricing model known as an "a la carte" pricing system.
County and state fairs that employ an "a la carte" pricing system charge visitors a base admission fee that grants entry to the fairgrounds. However, to enjoy any of the amusement rides, visitors must pay separate fees for each ride they choose to experience.
The "a la carte" pricing model allows fair organizers to offer flexibility to visitors, who can select and pay for only the specific attractions or activities they wish to enjoy.
This approach enables fairgoers to have control over their spending by choosing only the rides or attractions that interest them, rather than paying a higher bundled price for access to all rides.
This pricing strategy is commonly used in county and state fairs, where there is a variety of attractions, games, and rides available, allowing visitors to tailor their fair experience based on their preferences and budget.
Learn more about price here : brainly.com/question/19091385
#SPJ11
Nolvia sells copy machines, and her salary is $21,000 plus a 4% commission on sales. the equation s=21,000+ 0.04x
represents her salary s in dollars in terms of her total sales x in dollars.
part: 0/3
part 1 of 3
(a) how much money in sales does nolvia need to earn a salary that exceeds $40,000?
she needs to sell in excess of $
please help im getting timed
Answers
The amount of money in sales that Nolvia needs to earn a salary that exceeds $40,000 is greater than or equal to $19,000.
Given that:-
Fixed salary of Nolvia = $21,000
Commission tax that Nolvia gets = 4 %
Linear equation of Nolvia's salary and commission tax = 21000 + 0.04x
Where,
s represents her salary
x represents total sales
We have to find the amount of money in sales that Nolvia needs to earn a salary that exceeds $40,000.
The amount of money in sales that Nolvia needs to earn a salary that exceeds $40,000 = 40000 - 21000 ≥ $ 19,000
To learn more about Linear equation, here:-
https://brainly.com/question/11897796
#SPJ4
an insurance company checks police records on 582 accidents selected at random and notes that teenagers were at the wheel in 91 of them. (a) (8 pts) find the 95% confidence interval for , the true proportion of all auto accidents that involve teenage drivers. (note: for full credit, show all your work. no credit
Answers
The 95% confidence interval for the true proportion of all auto accidents involving teenage drivers is approximately (0.1205, 0.1927).
To find the 95% confidence interval for the true proportion of all auto accidents involving teenage drivers, we can use the formula for the confidence interval for a proportion.
The formula for the confidence interval is:
CI = p1 ± Z * √((p1 * (1 - p1)) / n)
Where:
CI is the confidence interval,
p1 is the sample proportion (proportion of accidents involving teenage drivers),
Z is the Z-score corresponding to the desired confidence level (95% confidence level corresponds to Z ≈ 1.96),
n is the sample size (number of accidents checked).
Given:
Number of accidents checked (sample size), n = 582
Number of accidents involving teenage drivers, x = 91
First, we calculate the sample proportion:
p1 = x / n = 91 / 582 ≈ 0.1566
Now we can calculate the confidence interval:
CI = 0.1566 ± 1.96 * √((0.1566 * (1 - 0.1566)) / 582)
Calculating the standard error of the proportion:
SE = √((p1 * (1 - p1)) / n) = √((0.1566 * (1 - 0.1566)) / 582) ≈ 0.0184
Substituting the values into the formula:
CI = 0.1566 ± 1.96 * 0.0184
Calculating the values:
CI = 0.1566 ± 0.0361
Finally, we can simplify the confidence interval:
CI = (0.1205, 0.1927)
Therefore, the 95% confidence interval for the true proportion of all auto accidents involving teenage drivers is approximately (0.1205, 0.1927).
To know more about confidence interval refer here:
https://brainly.com/question/32278466#
#SPJ11
If x-14=y+196 and y is 14 times of x then x=WHAT??
Answers
Answer:
x is 226.154…
Step-by-step explanation:
1) x-14=y+196
x=y+196+14
x=y+210
2)x=14y
3) 14y=y+210 collect like terms together
14y-y=210
13y=210 divide both sides by 13
y=16.154
4)x=y+210 meaning:
x=16.154+210
=226.154
Please help me I've been stumped on this problem

Answers
The measure of ∠CFE is 40°
How do we find ∠CEF?To solve for triangle ∠CEF, we know that
Parallel to DE is BC
Arc length BD = 58°
Arc length DE = 142°
We can then draw a diameter across the center of the circle and give it a name as the first step. The diameter in this situation is line ZT.
The arcs BD and DE are split in half by the line ZT.
Which is:
Arc SC = 1/(1/2(arc BC) = 1/(58)
Arc SC = 29°
142 = 1/2(arc DE) + arc TE
Arc TE = 71°
Sum of the angles of a semicircle is 180 degrees: Arc SC + Arc CE + Arc TE
29° + Arc CE + 71° = 180°
Arc CE + 100° = 180°
Arc CE = 180-100
Arc CE = 80°
Angle inscribed equals half of angle intercepted
CFE = 1/2 of Arc CE
<CFE = 1/2(80)
< CFE = 40°
The above answer is based on the full question below;
In circle A shown, BC || DE , mBC=58° and mDE=142°. Determine the measure of ZCFE . Show how you arrived at your answer
Find more exercises on measure of Triangles;
https://brainly.com/question/9524036
#SPJ1
Emma's sister is nine years older then Emma. Their combined ages add up to 49. How old is Emma
Answers
Answer:
emma is 20 because 49-9/2=40/2 which is 20
Step-by-step explanation:
Answer:20 years old
Step-by-step explanation:
49 = 20 + 29
40/2 = 20
9 years older than 20 is 29
the sides of an equilateral triangle inscribed in a circle are closer to the center of the circle than the sides of a square inscribed in the circle
Answers
Yes, that is correct. The sides of an equilateral triangle inscribed in a circle are closer to the center of the circle than the sides of a square inscribed in the same circle.
This is because an equilateral triangle has all its vertices on the circumference of the circle, whereas a square has only four of its vertices on the circumference. As a result, the sides of the equilateral triangle are closer to the center of the circle than the sides of the square. This property of inscribed shapes is important in geometry and has many practical applications in fields such as architecture and engineering.
More on equilateral triangle: https://brainly.com/question/13606105
#SPJ11
What is the midpoint of the segment shown below?

Answers
Answer:
The midpoint is (0,2)
Step-by-step explanation:
To find the x coordinate, average the x coordinates of the endpoints
(-4+4)/2 = 0/2 =0
To find the y coordinate, average the y coordinates of the endpoints
(6+-2)/2 = 4/2 =2
The midpoint is (0,2)
here is a scatterplot with its least squares regression line. lsr line with grid marks if there is scatter in the data about the line, there is prediction error. which value of x has the largest absolute prediction error?
Answers
Without seeing the scatterplot or the data, it is difficult to determine the exact value of x that has the largest absolute prediction error.
However, in general, the x-value with the largest absolute prediction error is typically the x-value that is farthest away from the regression line.
To calculate the prediction error for a given x-value, you can first calculate the predicted y-value for that x-value using the equation of the regression line. Then, you can subtract the actual y-value for that x-value from the predicted y-value to get the prediction error.
The absolute value of the prediction error represents the magnitude of the difference between the actual and predicted values, regardless of whether the prediction was too high or too low. Therefore, to find the x-value with the largest absolute prediction error, you can calculate the absolute prediction error for each x-value and then identify the x-value with the largest value.
To learn more about scatterplot refer below:
https://brainly.com/question/30017616
#SPJ11
Brenda can deliver 644644644 newspapers in 777 hours.
How many newspapers can Brenda deliver in 999 hours?
Answers
Answer:
8288288285
Step-by-step explanation:
777=644644644
999= 644644644*999/777
=
Answer: 828
Step-by-step explanation:
In a flower garden, there are 6 tulips for every 7 daisies. If there are 48 tulips, how many daisies are there?
Answers
Answer:
56, There are 56 daisies.
Step-by-step explanation:
Why are these terms considered Like Terms? 3y, y, 4y. Why are these terms not considered Like Terms? 3y, 3x, 3xy
ASAP!!!!!!!!!!!
will give brainlist
Answers
Answer:
like terms require the variables to be the same. 3y,y 4y are like terms because they all have y in common. 3y,3x,3xy are not like terms because the variable is not the same.
In a simple linear regression model we use the normal quantile plot of the residuals to evaluate if it is reasonable to assume the _____ come from a normal distribution.
a. Response Variable
b. Explanatory Variable
c. Observations
d. Errors
Answers
To determine whether the errors from the linear regression model are from a normal distribution, examine the normal quantile plot of the residuals.
Calculating the regression equation is the first step in a straightforward linear regression model. The link between the explanatory variable (x) and the response variable is modelled using this equation (y). A linear function of the explanatory variable, an intercept term, and an error term make up the regression equation. The errors or residuals (e), which indicate the difference between the observed and expected values of the response variable, are calculated as the following step. To evaluate the regression model's accuracy, the residuals are crucial. The residuals are then plotted using a normal quantile to see whether it is acceptable to believe that the errors are derived from a normal distribution. Because linear regression models presume that the errors are regularly distributed, this is significant. The residuals' normal quantile plot shows the distribution of the mistakes graphically, making it simpler to determine whether the errors follow a normal distribution. The linear regression model might not be the optimal one to employ if the errors do not follow a normal distribution.
Learn more about Linear regression here
brainly.com/question/29665935
#SPJ4