At the candy shop, Ameenah sells chocolate covered raisins, c, for $1.50 per pound, and peanuts, p, for $1.20 per pound. Ameenah wants to make 20 pounds of a mixture of raisins and peanuts that sells for $1.35 a pound. How many pounds of each should she use?
Thanks! :)
Answers
Answer:
10 pounds of raisins and 10 pounds of peanuts.
Step-by-step explanation:
Let c represent the pounds of chocolate covered raisins.
Let p represent the pounds of peanuts.
We know that the raisins cost $1.50 per pound and the peanuts cost $1.20 per pound.
Ameenah wants to make 20 pounds of a mixture of the raisins and peanuts that sells for 1.35 a pound. So, we can write the following expression:
\(1.5c+1.2p\)
This represents the cost given c pounds of raisins and p pounds of peanuts.
Ameenah wants to combine c and p to make them 1.35 per pound. In other words, the expression must equal:
\(1.5c+1.2p=1.35(c+p)\)
We also know that she wants to make 20 pounds. So, c plus p must total 20. Therefore:
\(c+p=20\)
We now have the system of equations:
\(\left\{ \begin{array}{ll} 1.5c+1.2p=1.35(c+p) \\ c+p=20\end{array}\)
First, since we know that c+p is 20, we can substitute that into the first equation.
Second, let's subtract p from both side for the second equation to isolate a variable. So:
\(c=20-p\)
Let's now substitute this into the first equation:
\(1.5(20-p)+1.2p=1.35(20)\)
Distribute:
\(30-1.5p+1.2p=27\)
Combine like terms:
\(-0.3p+30=27\)
Subtract 30 from both sides:
\(-0.3p=-3\)
Divide both sides by -0.3. So, the amount of peanuts needed is:
\(p=10\)
10 pounds of peanuts is needed.
This means that 20-10 or 10 pounds of raisins is needed.
Answer:
10 pounds of both raisins and peanuts.
Step-by-step explanation:
Related Questions
Find the slope of each line. Tell whether the slop is Positive, Negative, Undefined or Zero

Answers
Because the line crosses at the y axis and you would have to find another line that’s right on the corner of a square, so you divide 1 and 1 and it’s 1
Find the missing symbol: 8 ?
OA. >
B.<
C.=
Answers
The correct answer is A. >.
To find the missing symbol in the expression "8 ? (-10)", we can analyze the given numbers and their relationship.
The expression "8 ? (-10)" suggests that we need to compare or determine the relationship between 8 and -10 using a symbol. Let's evaluate the possibilities:
A. > (Greater than): If we assume that 8 is greater than -10, the expression would be 8 > (-10), which is true since 8 is indeed greater than -10.
B. < (Less than): If we assume that 8 is less than -10, the expression would be 8 < (-10), which is false since 8 is not less than -10.
C. = (Equal to): If we assume that 8 is equal to -10, the expression would be 8 = (-10), which is false since 8 is not equal to -10.
Based on the above analysis, the missing symbol that makes the statement true is A. > (Greater than).
Therefore, the correct answer is A. >.
Learn more about Inequality here
https://brainly.com/question/29210213
#SPJ4
Given question is incomplete, the complete question is below
Find the missing symbol: 8 ? (-10)
A. >
B.<
C.=
Pauline, Patricia and Polly are pie bakers at their bakery, Perfect Pies. They bake four different pie flavors: cherry, blueberry, apple and pecan. I understand question #1 but I need someone to help with questions 2-6 please.


Answers
Answer:
The answer is given below
Step-by-step explanation:
1) The persons are given by the matrix:
The number of different pie flavours is given by the matrix:
\(n=\left[\begin{array}{cccc}3&4&1&1\\6&6&4&6\\2&2&5&4\end{array}\right]\)
The cost of ingredients for each pie is given by the matrix:
\(I=\left[\begin{array}{ccc}3\\5\\2\\6\end{array}\right]\)
2)
\(\left[\begin{array}{ccc}Pauline\\Patricia\\Polly\end{array}\right] =\left[\begin{array}{cccc}3&4&1&1\\6&6&4&6\\2&2&5&4\end{array}\right] \left[\begin{array}{ccc}3\\5\\2\\6\end{array}\right] \\\left[\begin{array}{ccc}Pauline\\Patricia\\Polly\end{array}\right] =\left[\begin{array}{ccc}37\\92\\50\end{array}\right]\)
3) The cost of pie for Patricia = $92
The total cost of pie for all bakers = 37 + 92 + 50 = $179
The ratio of cost of Patricia pie to that of all three bakers = $92/$179 = 0.514
Patricia pie cost of ingredients is more than half of that of all three bakers
4)
The price of pie at Samuels sweet is represented by the matrix:
\(SA=\left[\begin{array}{ccc}8\\10\\7\\12\end{array}\right]\)
The income of each baker made by selling at samuels sweets is:
\(\left[\begin{array}{ccc}Pauline\\Patricia\\Polly\end{array}\right] =\left[\begin{array}{cccc}3&4&1&1\\6&6&4&6\\2&2&5&4\end{array}\right] \left[\begin{array}{ccc}8\\10\\7\\12\end{array}\right] \\\left[\begin{array}{ccc}Pauline\\Patricia\\Polly\end{array}\right] =\left[\begin{array}{ccc}83\\208\\119\end{array}\right]\)
The price of pie at Sugary Sarah is represented by the matrix:
\(SS=\left[\begin{array}{ccc}8\\9\\8\\13\end{array}\right]\)
The income of each baker made by selling at Sugary Sarah is:
\(\left[\begin{array}{ccc}Pauline\\Patricia\\Polly\end{array}\right] =\left[\begin{array}{cccc}3&4&1&1\\6&6&4&6\\2&2&5&4\end{array}\right] \left[\begin{array}{ccc}8\\9\\8\\13\end{array}\right] \\\left[\begin{array}{ccc}Pauline\\Patricia\\Polly\end{array}\right] =\left[\begin{array}{ccc}81\\212\\126\end{array}\right]\)
5) Patricia yielded the greatest income. She made $208 + $212 = $420
6) Polly made $126 from selling at Sugary Sarah
what is half of 9 minutes 28 seconds
Answers
Answer : 4.73333333 Minutes
Explanation: Divide
◊ YusuCr ◊
Hey there!
1 minute = 60 seconds
9 minutes = 9 × 60 = 540 seconds
9 min + 28 secs
= 540 + 28
= 568 secs
½ of 568 = 284 secs
284 secs
= 284/60
= 4 min 7333... sec
Hope it helps ya!
Does this equation have one solution, many solution or no solutions? and why? I need to show my work

Answers
Answer: I worked it out on a piece of paper then attached it. It is a No Solution
Step-by-step explanation:

Answer:
−12x−4=−(x+1)
−12x−4=−x−1
−11x−4=−1
−11x=3
and this is your answer x=−3/11
You start at (-3, 5). You move right 1 unit. Where do you end?
Answers
Answer: -3,6
Step-by-step explanation:
x=-3 and y=5 so we are moving one unit up the y-axis which would equal to -3,6. I'm pretty sure.
Answer:(-2,5)
because -3 is x while 5 is y if you move to the right the y stays the same but x changes and x=-3 if you move to the right it becomes -2 so its
(-2,5)
Step-by-step explanation:
State the domain, equations of all asymptotes, intervals of increasing/decreasing and concavity, max/min points, points of inflection and sketch: f(x) = x³-2x²+8 / x²-4
Answers
The domain of f(x) = (x³-2x²+8)/(x²-4) is (-∞, -2) ∪ (-2, 2) ∪ (2, ∞).
Vertical asymptotes: x = -2, x = 2. Horizontal asymptote: y = 0. Intervals of increasing: (-∞, 0) ∪ (1, ∞), decreasing: (0, 1). Concave up: (-∞, 1), concave down: (1, ∞). No max/min points. Point of inflection: x = 1.
To find the domain, exclude values that make the denominator zero (x = ±2). Vertical asymptotes occur where the denominator equals zero. Horizontal asymptote exists when the degree of the numerator is less than the degree of the denominator.
Determine the increasing/decreasing intervals by finding the first derivative (f'(x)) and solving f'(x) > 0 for increasing, f'(x) < 0 for decreasing. Find concavity by finding the second derivative (f''(x)) and solving f''(x) > 0 for concave up, f''(x) < 0 for concave down. No max/min points because f'(x) is not zero. The point of inflection is found where f''(x) = 0.
To know more about Vertical asymptotes click on below link:
https://brainly.com/question/29260395#
#SPJ11
I need help please and thanksss

Answers
Answer:
64
Step-by-step explanation:
Trust me, this is the answer, PLEASE GIVE ME BRAINLIEST
4(x + 6) = [?]x + [ ]
Answers
The equivalent expression for 4(x + 6) is 4x + 24.
What is distributive property?
Distributive property is multiplying the sum of two or more addends by a number will give the same result as multiplying each addend individually by the number and then adding the products together.
In other words, according to the distributive property, an expression of the form a(b + c) can be solved as:
\(\sf a(b+c)=ab+ac\)
Given the question above, we need to find the equivalent expression for 4(x + 6).
So,
\(\sf 4(x+6)=[?]x+[?]\)
Multiply 4 on both sides.
\(=\sf 4x\)
\(\sf =24\)
Then combine them into the equivalent expression form.
\(\sf 4x + 24\)
\(\rightarrow\sf 4(x+6)=4x + 24\)
Thus, The equivalent expression for 4(x + 6) is 4x + 24.
Learn more about distributive property at:
https://brainly.com/question/13130806
what is the answer to 20x + 35y
Answers
The greatest common factor is 5 .
If you factor it out, the expression becomes 5 (4x + 7y) .
Answer: 55x^1 y^1
Step-by-step explanation:
Add 20+35= 55
x & y can't stand by it's self, so x^1 and y^1
So you take those answers and you got 55x^1 y^1
You must keep it in letters in alphabetic order or it's considered wrong.
simple linear regression analysis differs from multiple regression analysis in that . multiple choice simple linear regression uses only one explanatory variable the coefficient of correlation is meaningless in simple linear regression goodness-of-fit measures cannot be calculated with simple linear regression the coefficient of determination is always higher in simple linear regression
Answers
Simple linear regression analysis differs from multiple regression analysis in (A) Only simple linear regression uses one explanatory variable.
What is Simple linear regression analysis?A regression model called simple linear regression uses a straight line to calculate the association between one independent variable and one dependent variable.
Both variables ought to have numerical values.
Multiple regression analysis and simple linear regression analysis are different One explanatory variable is used only in simple linear regression.
If we know the height of a person, we could apply the equation to forecast weight.
Y = MX + b, where X is the predictor (independent) variable, m is the estimated slope, and b is the expected intercept, which is the formula for simple linear regression.
Therefore, simple linear regression analysis differs from multiple regression analysis in (A) Only simple linear regression uses one explanatory variable.
Know more about Simple linear regression analysis here:
https://brainly.com/question/26755306
#SPJ4
Correct question:
Simple linear regression analysis differs from multiple regression analysis in that:
a. multiple choice simple linear regression uses only one explanatory variable.
b. the coefficient of correlation is meaningless in simple linear regression
c. goodness-of-fit measures cannot be calculated with simple linear regression
d. the coefficient of determination is always higher in simple linear regression
(Expected rate of return and risk) B. J. Gautney Enterprises is evaluating a security. One-year Treasury bills are currently paying 4.8 percent. Calculate the investment's expected return and its standard deviation. Should Gautney invest in this security? Probability 0.20 Return - 4% 4% 7% 0.45 0.15 0.20 10% (Click on the icon in order to copy its contents into a spreadsheet.) ...) a. The investment's expected return is%. (Round to two decimal places.)
Answers
The investment's expected return is 5.95%.
Is the investment's expected return favorable for Gautney?The expected return of an investment is calculated by multiplying the probabilities of each possible return by their respective returns and summing them up. In this case, Gautney Enterprises has provided the probabilities and returns for the investment. By applying the formula, we find that the expected return is 5.95%.
To calculate the standard deviation, we need to determine the variance first. The variance is computed by taking the difference between each possible return and the expected return, squaring those differences, multiplying them by their respective probabilities, and summing them up. Once we have the variance, the standard deviation is simply the square root of the variance. The standard deviation measures the degree of risk associated with an investment.
In this scenario, the expected return of the investment is 5.95%, but we need to consider the standard deviation as well to assess the risk. If the standard deviation is high, it indicates a greater level of uncertainty and potential volatility in returns. A low standard deviation implies a more stable investment.
Without the specific values for each return and their respective probabilities, we cannot calculate the exact standard deviation. However, Gautney Enterprises should compare the calculated expected return and the associated standard deviation to their risk tolerance and investment objectives. If the expected return meets their desired level of return and the standard deviation aligns with their risk appetite, they may consider investing in this security.
Learn more about standard deviation
brainly.com/question/31516010
#SPJ11
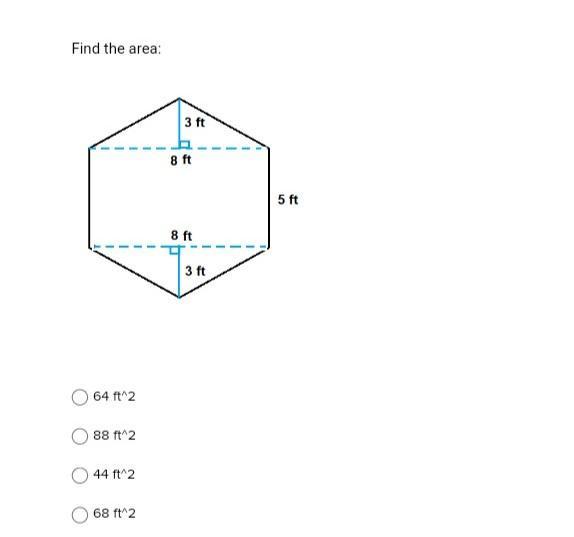
Find the area:
68 ft^2
44 ft^2
88 ft^2
64 ft^2
Answers
Answer:
Step-by-step explanation:
\(Area \ of \ triangle = \dfrac{1}{2}bh\\\)
\(=\dfrac{1}{2}*8*3\\\\\\= 4*3\\\\\\= 12 \ ft^{2}\)
Area of rectangle = length *width
= 8 * 5
= 40 ft²
Area of the figure = Area of rectangle + 2* area of the triangle
= 40 + 2*12 = 40 + 24
= 64 ft²
In the previous question, write your answer in the standard form (namely, enter your answer exactly in the form of Ax + By = C) and also simplify as much as possible. The enter your equation below. Do not type any spaces or extra character. Find the equation of a line passing through (3,4) and (1,-4). Enter your answer in the slope-intercept form (namely, type your answer exactly in the form of y=mx+b).
Answers
It should be noted that the equation of the line passing through the points (3, 4) and (1, -4) is y = 4x - 8.
How to explain the equationIn order to find the equation of a line passing through two points, (x₁, y₁) and (x₂, y₂), you can use the point-slope form of the equation, which is:
y - y₁ = m(x - x₁),
where m is the slope of the line.
Given the points (3, 4) and (1, -4), we can calculate the slope (m) using the formula:
m = (y₂ - y₁) / (x₂ - x₁).
Plugging in the values:
m = (-4 - 4) / (1 - 3) = -8 / -2
= 4.
Now that we have the slope (m) and one of the points (3, 4), we can use the point-slope form to write the equation of the line:
y - 4 = 4(x - 3).
Simplifying:
y - 4 = 4x - 12.
Moving the constant term to the right side:
y = 4x - 12 + 4.
y = 4x - 8.
Therefore, the equation of the line passing through the points (3, 4) and (1, -4) is y = 4x - 8.
Learn more about equations on
https://brainly.com/question/2972832
#SPJ4
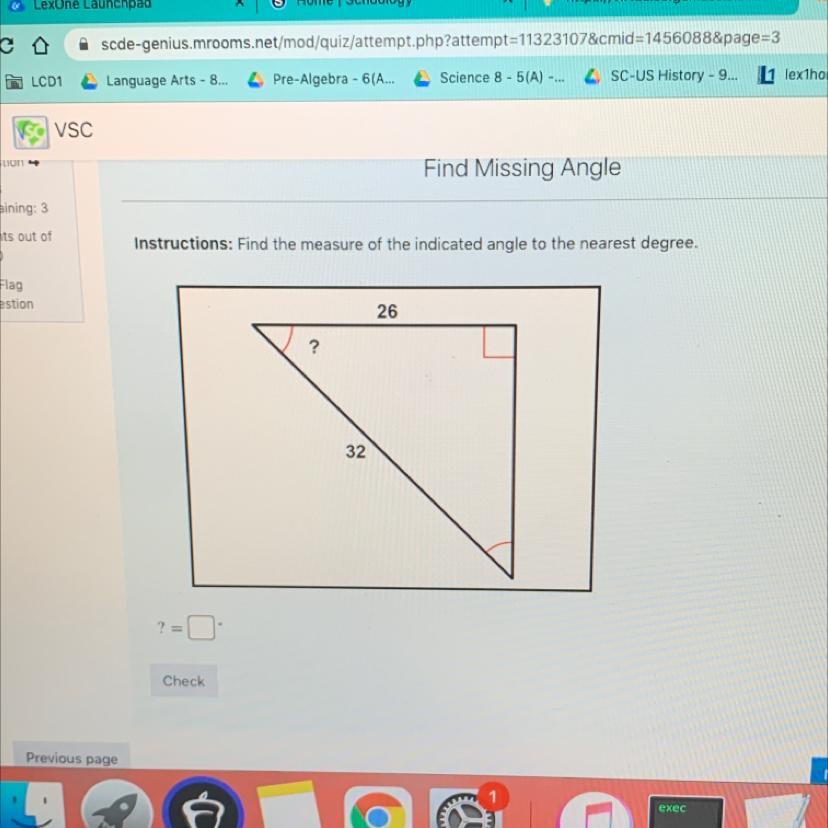
helpppp meeeee please
Answers
Answer:
?= 35.66º
Step-by-step explanation:
26/32=0.8125
cos 35.66º=0.8125
Answer:
? = 36 degrees
Step-by-step explanation:
Use trigonometry!
since we know the adjacent and hypotenuse sides, use cos.
cos(?) = adjacent/hypotenuse = 26/32
? = arccos(26/32)
? = 35.659
Rounding it up, we get.
? = 36 degrees
how is the answer 4??

Answers
Answer:
see below
Step-by-step explanation:
log sqrt5 (25) = y
we know that loga (b) = c can be rewritten as a^c = b
sqrt(5) ^ y = 25
Rewriting sqrt(5) as 5^1/2 and 25 as 5^2
5^1/2 ^ y = 5^2
we know a^b^c = a^ (b*c)
5 ^ 1/2y = 5^2
1/2y = 2
y = 4
The number of cars running a red light in a day, at a given intersection, possesses a distribution with a mean of 4.2 cars and a standard deviation of 33. The number of cars running the red light was observed on 100 randomly chosen days and the mean number of cars calculated. Describe the sampling distribution of the sample mean.
The number of cars running a red light in a day, at a given intersection, possesses a distribution with a mean of
4.24.2
cars and a standard deviation of
33.
The number of cars running the red light was observed on 100 randomly chosen days and the mean number of cars calculated. Describe the sampling distribution of the sample mean.
Answers
Answer:
approximately normal with mean=4.2 and standard deviation=0.3.
The sampling distribution of the sample mean is a normal distribution with a mean equal to the population mean and a standard deviation equal to the population standard deviation divided by the square root of the sample size. In this case, since the population mean is 4.2 cars and the population standard deviation is 3 cars, and we have a sample size of 100 days, then the sampling distribution of the sample mean will have a mean of 4.2 cars and a standard deviation of 3/sqrt(100) = 0.3 cars.
Step-by-step explanation:
The sampling distribution of the sample mean is the distribution of the mean of a sample of observations from a population. In this case, the sampling distribution of the sample mean would be a normal distribution with a mean of 4.2 and a standard deviation of 33/sqrt(100) = 1.6. This means that 68% of the time, the sample mean would be between 2.6 and 5.8, and 95% of the time, the sample mean would be between 1.6 and 7.8.
The sampling distribution of the sample mean is important because it can be used to make inferences about the population mean. For example, if the sample mean is 5.8, we can be 95% confident that the population mean is between 1.6 and 7.8.
Help me please I will give brainliest!

Answers
Answer:
the answer is 1 1/4
Step-by-step explanation:
1/4 multiple 5= 5/4 or 1 1/4
a certain group of test subjects had pulse rates with a mean of 82.1 beats per minute and a standard deviation of 12.2 beats per minute. use the range rule of thumb for identifying significant values to identify the limits separating values that are significantly low or significantly high. is a pulse rate of 136.5 beats per minute significantly low or significantly high?
Answers
The range rule of thumb can be used to identify significantly low or high values based on the mean and standard deviation of a data set. Based on the given information, a pulse rate of 136.5 beats per minute is significantly high.
The range rule of thumb states that values that are more than two standard deviations away from the mean can be considered significantly low or significantly high. In this case, the mean pulse rate is 82.1 beats per minute with a standard deviation of 12.2 beats per minute. To determine the limits, we need to calculate the upper and lower bounds.
The upper bound is found by adding two standard deviations to the mean:
Upper bound = Mean + (2 × Standard deviation)
Upper bound = 82.1 + (2 × 12.2) = 106.5 beats per minute
Since the pulse rate of 136.5 beats per minute is higher than the upper bound of 106.5, it can be considered significantly high.
In conclusion, a pulse rate of 136.5 beats per minute is significantly high based on the range rule of thumb, which considers values more than two standard deviations away from the mean as significant.
To learn more about range rule refer:
https://brainly.com/question/27889407
#SPJ11
In Monogram, Robert Rauschenberg put everyday objects together with collage and painting to form what he called Group of answer choices combine-paintings. installations. site-specific works. action paintings.
Answers
In Monogram, Robert Rauschenberg created combine-paintings by assembling everyday objects through collage and painting techniques. This artwork showcased his unique approach of combining various elements to form a cohesive artistic composition.
Robert Rauschenberg's Monogram exemplifies his innovative approach of combining different mediums and materials in his artwork. He coined the term "combine-paintings" to describe these pieces that brought together everyday objects, such as a stuffed goat, tires, and various found materials, with painting and collage techniques.
Rauschenberg's aim was to challenge traditional boundaries and definitions of art by blurring the lines between painting and sculpture, two-dimensional and three-dimensional forms. By incorporating familiar objects into his artworks, he explored themes of consumerism, popular culture, and the relationship between art and everyday life. Through his combine-paintings, Rauschenberg pushed the boundaries of artistic expression and opened up new possibilities for artistic creation.
Learn more about consumerism here:
https://brainly.com/question/29795532
#SPJ11
what is the difference between population and sample in statistics
Answers
Population refers to the entire group of individuals or items that share a common characteristic and are of interest to the researcher. It is the complete set of individuals or items from which data is collected and analyzed. For example, if we are studying the average height of all students in a school, the population would include every student enrolled in that school.
Sample, on the other hand, refers to a subset of the population that is selected to represent the whole population. It is a smaller group of individuals or items that are chosen from the population to provide information about the entire population. Using the same example, if we randomly select 100 students from the school to measure their height, those 100 students would be considered the sample.
Here are a few key differences between population and sample:
1. Size: The population is typically larger than the sample. It includes all the individuals or items of interest, while the sample is a smaller representation of the population.
2. Data Collection: It is often more practical and feasible to collect data from a sample rather than the entire population. Gathering data from a large population can be time-consuming, costly, and sometimes even impossible.
3. Representativeness: The sample should ideally be representative of the population. This means that the characteristics and attributes of the sample should closely mirror those of the population. This ensures that the findings from the sample can be generalized to the larger population.
4. Precision: The larger the sample size, the more precise and accurate the estimates are likely to be. A larger sample size reduces the impact of random variability and increases the reliability of the results.
In conclusion, the population refers to the entire group of individuals or items of interest, while the sample is a smaller subset of the population that is chosen to represent the whole. The choice between using a population or a sample depends on various factors such as feasibility, time, resources, and the research objectives.
To know more about population and sample in statistics here:
brainly.com/question/14362979
#SPJ11
9. the water temperature at the beach
Answers
Answer:
79 degrees
Step-by-step explanation:
No Explanation
what is the area of the rhombus with one side as 32cm and one diagonal as 18 meters
Answers
the area of the rhombus=32cm; one diagonal (q)=18meters
p=(2×area)/q
p=(2×32)/18=18
therefore the length of the unknown diagonal is 18.
the unknown diagonal can be calculated using the perimeter of the rhombus which is given as 32cm; one diagonal (p)=18 half of this diagonal
=18÷2=9units
A case of soda costs $3.50 with tax. Mr. Gardner has $30 he can spend on soda for the Mountaineer Market. How many cases can he buy? cases of soda
Answers
Answer:
he can buy 8!
Step-by-step explanation:
Answer:
8
Step-by-step explanation:
I don't know if this is mathematically correct ways to solve this but here's how I did it: I divided 30 by 3.50 and got 8.57... so then I just mentally concluded that he can buy 8
what number should be added to complete the square of the following expression? x^2 -2/5x
4/25
-1/5
-2/25
1/25
Answers
Option D is correct- 1/25 should be added to complete the square of the expression.
Square equationQuadratics can be defined as a polynomial equation of a second degree, which implies that it comprises a minimum of one term that is squared. It is also called quadratic equations.
Expression
Expressions in math are mathematical statements that have a minimum of two terms containing numbers or variables, or both, connected by an operator in between.
we have to add the 1/25 to the square of the equation, x^2 - 2/5x
by adding 1/25 in the equation, we get
x ^2 -2/5x +1/25
= (x)^2 - 2* x* 1/5 + (1/5)^2
= (x - 1/5)^2
so, 1/25 must be added.
Learn more about equation here :-
https://brainly.com/question/19950555
#SPJ4
Commercials for chewing gum make claims about how long the flavor will last. In fact, some commercials claim that the flavor lasts too long, affecting sales and profit. Let’s put those claims to a test. Imagine a student decides to compare four different gums using five participants. Each randomly selected participant was asked to chew a different piece of gum each day for 4 days, such that at the end of the 4 days, each participant had chewed all 4 types of gum. The order of the gums was randomly determined for each participant. After 2 hours of chewing, participants recorded the intensity of flavor from 1 (not intense) to 9 (very intense). Here are some hypothetical data:
Answers
Analysing the data and evaluating the claims about the duration of flavor, we use analysis of variance (ANOVA) to compare the mean flavor intensities of the four gums.
Let's assume we have the following hypothetical data for the flavour intensity ratings:
Participant 1: Gum A: 7,Gum B: 6,Gum C: 8,Gum D: 7
Participant 2: Gum A: 6,Gum B: 5,Gum C: 7,Gum D: 6
Participant 3: Gum A: 8,Gum B: 7,Gum C: 9,Gum D: 8
Participant 4: Gum A: 7,Gum B: 6,Gum C: 8,Gum D: 7
Participant 5: Gum A: 6,Gum B: 5,Gum C: 7,Gum D: 6
We have 5 participants who each chewed 4 different types of gum (A, B, C, D) over 4 days. The flavor intensity ratings were recorded after 2 hours of chewing, ranging from 1 to 9.
To analyze the data and evaluate the claims about the duration of flavor, we can use analysis of variance (ANOVA) to compare the mean flavor intensities of the four gums. ANOVA helps determine if there is a statistically significant difference in the mean flavor intensities among the groups.
Here are the steps to conduct ANOVA:
Set up hypotheses:
Null hypothesis (H₀): The mean flavor intensities of the four gums are equal.
Alternative hypothesis (Hₐ): The mean flavor intensities of the four gums are not equal.
Calculate the sum of squares:
Calculate the total sum of squares (SST) by summing the squared differences between each observation and the overall mean.
Calculate the between-group sum of squares (SSB) by summing the squared differences between each group mean and the overall mean, weighted by the number of observations in each group.
Calculate the within-group sum of squares (SSW) by summing the squared differences between each observation and its respective group mean.
Calculate the degrees of freedom:
Degrees of freedom between groups (dfB) = Number of groups - 1
Degrees of freedom within groups (dfW) = Number of observations - Number of groups
Calculate the mean squares:
Mean square between groups (MSB) = SSB / dfB
Mean square within groups (MSW) = SSW / dfW
Calculate the F-statistic:
F-statistic = MSB / MSW
Determine the critical value or p-value:
Using the F-statistic and degrees of freedom, you can look up the critical value from an F-distribution table or use statistical software to calculate the p-value.
Compare the obtained F-value with the critical value or p-value:
If the obtained F-value is greater than the critical value (or if the p-value is less than the significance level, often 0.05), reject the null hypothesis and conclude that there is a significant difference in the mean flavor intensities among the gums.
If the obtained F-value is less than the critical value (or if the p-value is greater than the significance level), fail to reject the null hypothesis and conclude that there is not enough evidence to suggest a significant difference in the mean flavor intensities among the gums.
By following these steps, you can perform an ANOVA analysis to evaluate the claims about the duration of flavor and determine if there is a significant difference in the mean flavor intensities among the four different gums.
Learn more about ANOVA here:
https://brainly.com/question/30459773
#SPJ11
i need help with this pls 20 points for the right answer

Answers
Answer:
hiiii
Step-by-step explanation:
sorry I have not idea like what garde are u I'm
Leroy spends a few minutes connecting a hose to a water
spigot. He then adds water at a constant rate to a partially
filled pool. He turns off the hose when the pool is full.
Which graph could represent this scenario?
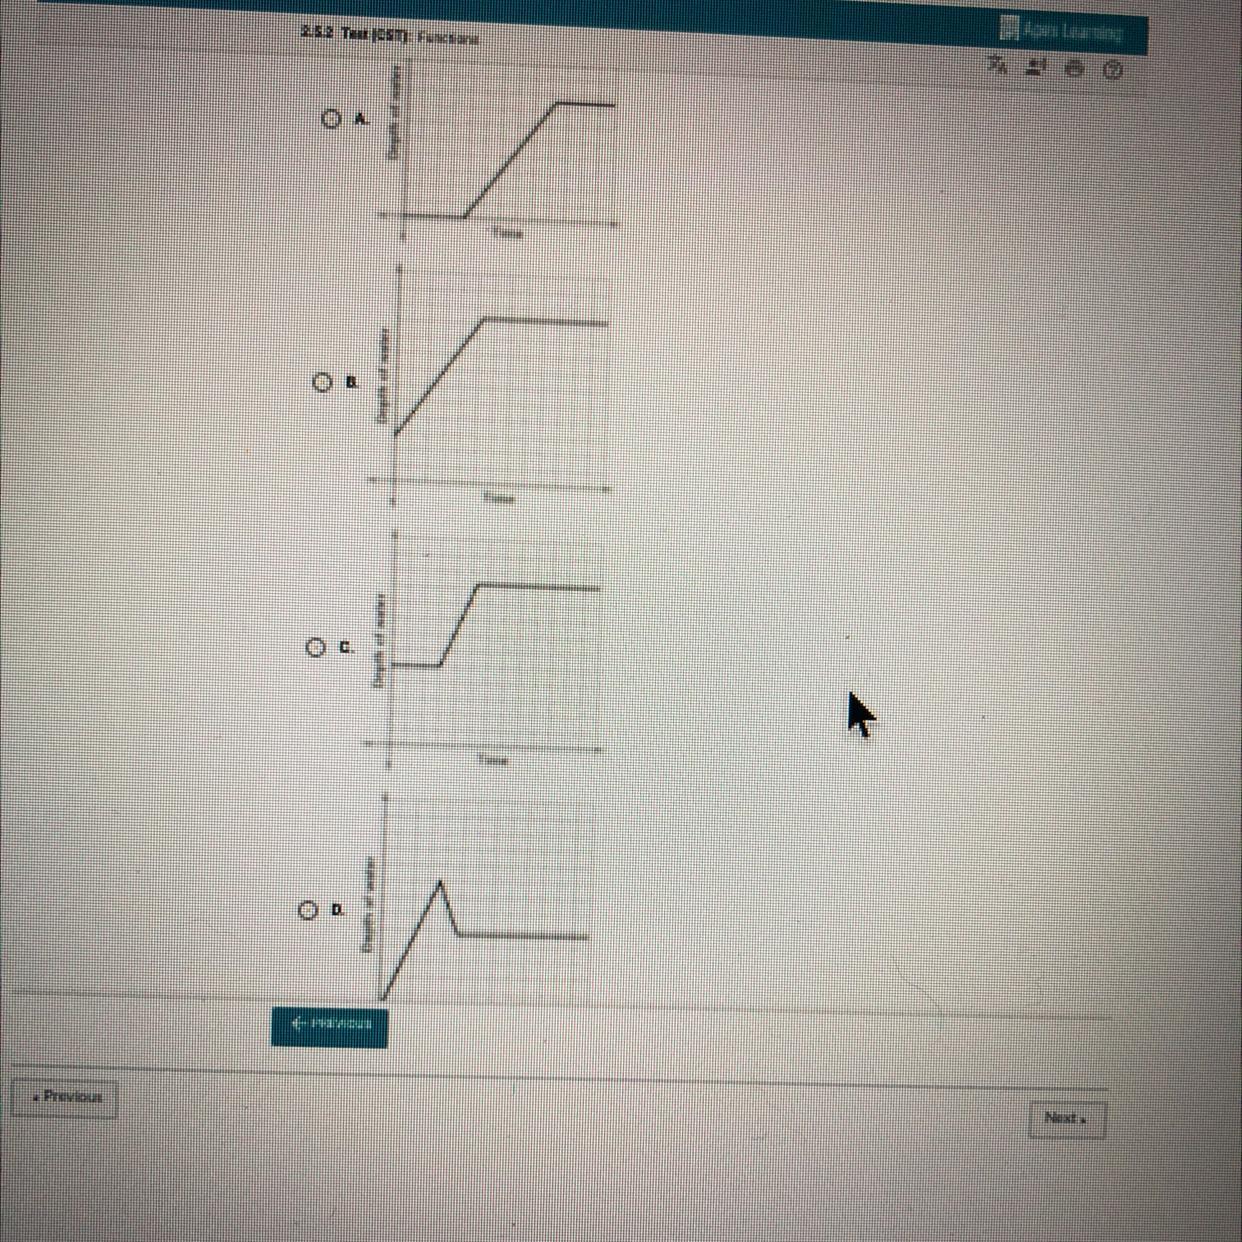
Answers
Answer:
It’s A
Step-by-step explanation:
just did this
Answer:
Step-by-step explanation:
trust me
g Fisher's Exact Test is used when there are ______samples of categorical data. Group of answer choices two independent two paired more than two independent none of the above
Answers
Fisher's Exact Test is used when there are two independent samples of categorical data, and it is a valuable tool for analyzing small sample sizes where other tests may not be appropriate.
Fisher's Exact Test is used when there are two independent samples of categorical data. This test is specifically designed to determine if there is a significant association between two categorical variables in a 2x2 contingency table.
It is commonly used when the sample size is small, which can cause issues with other statistical tests such as the chi-square test.
The two independent samples refer to two different groups or populations that are being compared. For example, we might be interested in comparing the success rates of a new drug treatment versus a placebo in a clinical trial, where success and failure are the two categories being considered.
Fisher's Exact Test calculates the probability of observing the data given the null hypothesis of no association between the variables. It does this by considering all possible arrangements of the data that have the same marginal totals. If the calculated probability is very small (typically less than 0.05), we reject the null hypothesis and conclude that there is a significant association between the variables.
In summary, Fisher's Exact Test is used when there are two independent samples of categorical data, and it is a valuable tool for analyzing small sample sizes where other tests may not be appropriate.
To know more about Fisher's visit;
brainly.com/question/23114319
#SPJ11
HELP ON A TIMER
WHAT IS THE x-intercept of the graph?
